


Where Will the Stock Market Go Next?
Stock-Markets / US Stock Markets Nov 15, 2008 - 07:11 AM GMTBy: Marty_Chenard

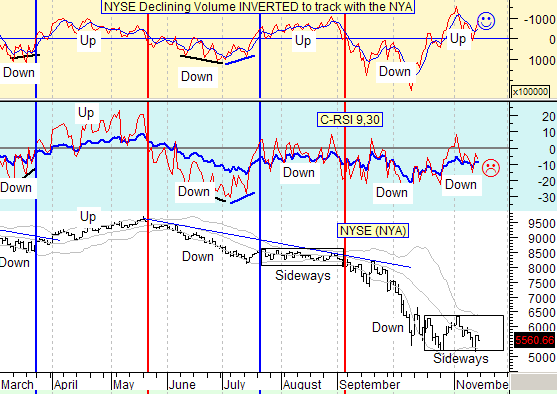
This chart is part of a Multi-Indicator Model that we post on our paid website every day. There are actually 5 Indicators on the chart, and we will show two of them this morning.
The chart below compares the market action of the New York Stock Exchange Index to the trend of the Declining Volume on the NYSE, and a C-RSI (Relative Strength) on the NYSE.
At the top of the chart is the NYSE's trend of Declining Volume. Its action moves opposite to the market, so we inverted it so that it tracks directly with the NYSE without being confusing.
The second graph is a zero based RSI (Relative Strength Index) of the NYSE. (Pay particular attention to the blue C-RSI line.)
How they work with the NYSE Index is fairly straight forward ...
1. If both are above zero and trending up, then the NYSE and the market trends higher .
2. If both are trending below zero and trending down, then the NYSE and the market trends lower .
What if they don't both move in unison together?
3. However, if the Inverted NYSE Declining Volume is above zero and trending up, BUT the C-RSI is negative with a down trend ... then the market moves sideways in a trading range .
So, what was it saying as of 10:30 AM on Friday morning?
Well, the Inverted NYSE Declining Volume was positive, but the C-RSI was negative , so that mixed condition is the prescription for a sideways trading range. The only difference from sideways range in August is the amount of Volatility on the VIX which is giving us a wider up and down range. (This chart is updated daily on our paid subscriber site.)
____________________________________________________________________
*** Feel free to share this page with others by using the "Send this Page to a Friend" link below.
By Marty Chenard
http://www.stocktiming.com/
Please Note: We do not issue Buy or Sell timing recommendations on these Free daily update pages . I hope you understand, that in fairness, our Buy/Sell recommendations and advanced market Models are only available to our paid subscribers on a password required basis. Membership information
Marty Chenard is the Author and Teacher of two Seminar Courses on "Advanced Technical Analysis Investing", Mr. Chenard has been investing for over 30 years. In 2001 when the NASDAQ dropped 24.5%, his personal investment performance for the year was a gain of 57.428%. He is an Advanced Stock Market Technical Analyst that has developed his own proprietary analytical tools. As a result, he was out of the market two weeks before the 1987 Crash in the most recent Bear Market he faxed his Members in March 2000 telling them all to SELL. He is an advanced technical analyst and not an investment advisor, nor a securities broker.
Marty Chenard Archive |
© 2005-2022 http://www.MarketOracle.co.uk - The Market Oracle is a FREE Daily Financial Markets Analysis & Forecasting online publication.