


A Stock Market Chart That’s Out of This World
Stock-Markets / Stock Market 2025 Feb 11, 2025 - 07:45 PM GMTBy: EWI

Valuations Are at the Furthest Edge of the Financial Solar System
By Robert Prechter, excerpted from the January 2025 Elliott Wave Theorist.
Figure 1 updates our history of year-end valuations for stocks of S&P companies on two bases: price to book value (Y axis) and dividend yield (X axis). I thought the year-end 2021 overvaluation would never be surpassed. But as you can see, the year-end 2024 reading is both higher and further to the right. It is the highest multiple ever recorded for S&P Industrials’ price to book value and the fifth-lowest level for the S&P Composite’s dividend yield, the four lower readings all occurring in 1998-2001.
We have long called this our Pluto chart. Perhaps we should have expected another extreme valuation near that of 2021. After all, Pluto was discovered to be a planet pair.
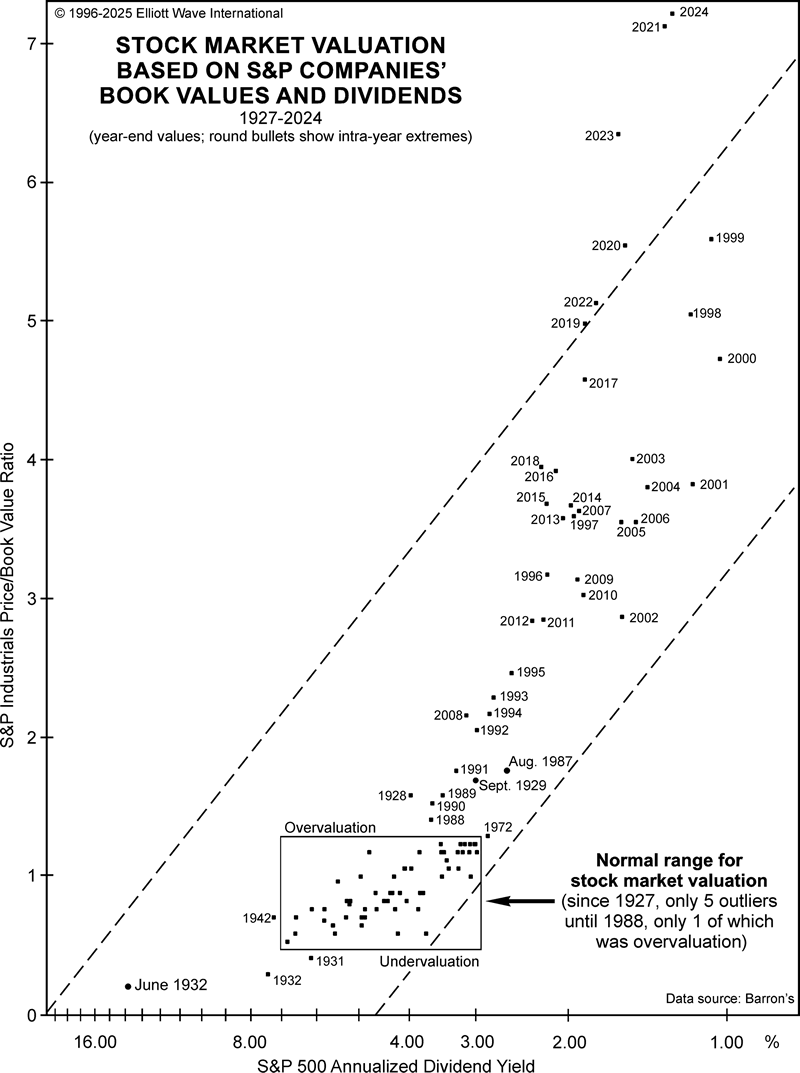 |
The extreme readings of 1998-2001 stayed within the dashed-line channel, but the past six years’ closing valuations are all beyond it. In three of those years — 2021, 2023 and 2024 — price to book value was above that of 1999, the year of the all time high in stock indexes priced in real money (gold)... |
This article was syndicated by Elliott Wave International and was originally published under the headline Is Trump the 'Most Pro-Stock Market President' Ever?. EWI is the world's largest market forecasting firm. Its staff of full-time analysts led by Chartered Market Technician Robert Prechter provides 24-hour-a-day market analysis to institutional and private investors around the world.
© 2005-2022 http://www.MarketOracle.co.uk - The Market Oracle is a FREE Daily Financial Markets Analysis & Forecasting online publication.