


Stocks Correct into Bitcoin Happy Thanks Halving - Earnings Season Buying Opps
Stock-Markets / Financial Markets 2024 Jul 04, 2024 - 05:50 AM GMTBy: Nadeem_Walayat

Dear Reader
It's 4th July 2024 Britains Independance Day from Clown Sunak.
The polls will be opening at 7am today when the British electorate get to give their damning verdict on what will likely be one of the worst governments in British history led by a Clown, Rishi Sunak, a fool who was never fit to be an MP let alone a PM. Not for much longer as this fool will be out of No 10 within 24 hours, the writing is on the wall, Liebour is heading for a landslide election victory of well over 400 seats as the Tories die an electoral death.
This article Stocks Correct into Bitcoin Happy Thanks Halving - Earnings Season Buying Opps was first made available to patrons who support my work. So for immediate first access to ALL of my analysis and trend forecasts then do consider becoming a Patron by supporting my work for just $7 per month, lock it in now at $7 before next rises to $10 per month for new sign-ups. https://www.patreon.com/Nadeem_Walayat.
CONTENTS
S&P USD Correction
Stock Market Sentiment
Stock Market Trend Forecast 2024
Tesla Robo Taxis are Coming THIS YEAR!
How to Further Capitalise on Robots
AI Stocks Portfolio Accumulate and Distribute
Q1 Earnings Season
TSM - $127.EGF +4%, +30%, PE 24.3, PE Range 73%
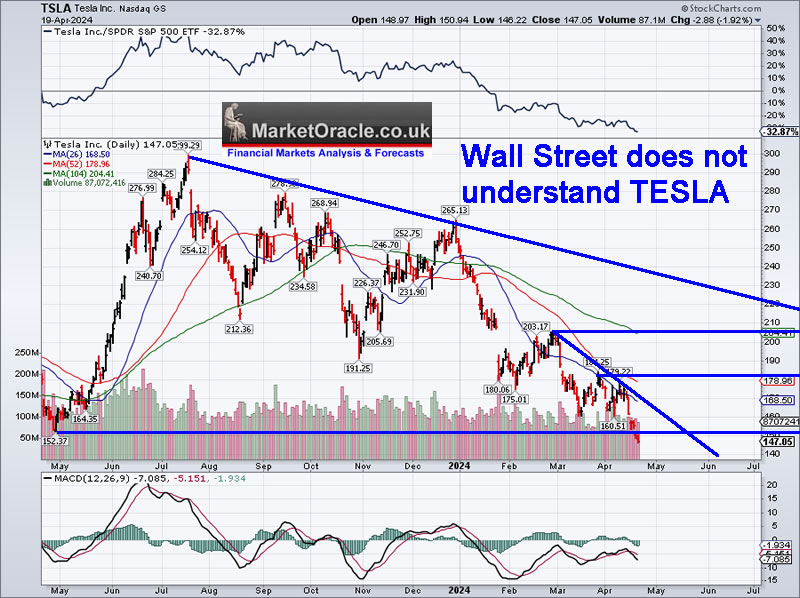
TSLA - $147 - EGF -21%, +2%, P/E 47, PE Range -75%
RTX $102 - EGF +2%, +356%. PE 20
META $481 - EGF +24%, +39%, PE 30.9, PE Range 153%
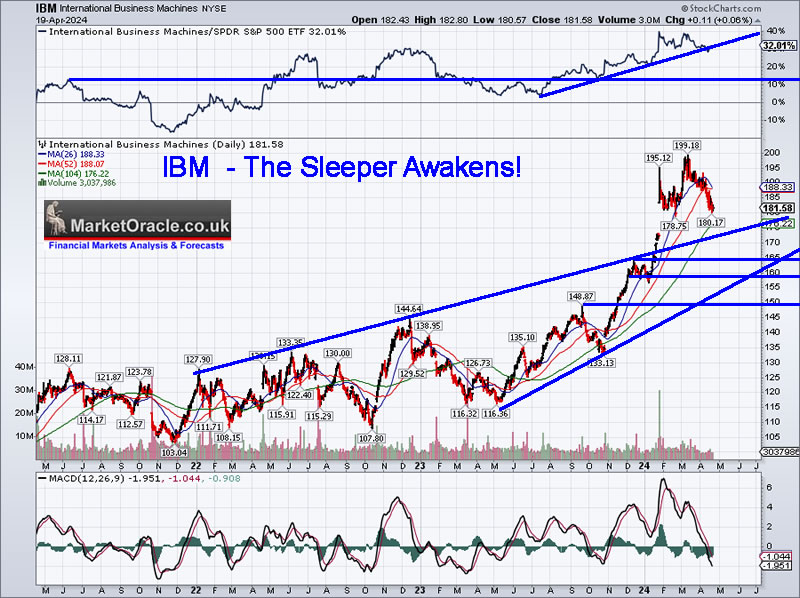
IBM $181 - EGF +14%, +7%, PE 18.9, PE range 337%
Lam Research - $870, EGF +8%, +16%, PE 31.8, PE Range 173%
Google $156 - EGF +8%, +25%, PE 26.8, 89% of PE Range
INTEL $34, EGF R29%, R62%, PE 34.2, PE Range 1300%
Microsoft $399 - EGFs +4%, +12%, PE 36.1, PE Range 82%
KLAC $628 - EGFs -2%, +9%, PE 19, PE Range 164%.
WD $66, EGFs -83%, -154%, PE -11
AMAZON $175 - EGFs +30%, +68%, PE 62 , PE Range 69%
AMD $147 - EGFs +3%, +60%, PE 55, PE Range 95%
Bitcoin Happy Thanks Halving
Crypto's Exit Strategy
The smoke in mirrors drama in the middle east delivers an opportunity in target stocks Friday following Iran falling face first into the Fourth Reich's (FR) trap, where the fatal mistake was the failed retaliation to the FR blowing up the Iranian Embassy that allowed the FR to target Iranian nuclear facilities in respect of which Iran had to make the choice to either further be played like puppets on a string or pretend that the Israeli attack failed to do any damage, Intelligently Iran chose the later and thus threw up a smoke screen of having successfully shot down a couple of Israeli drones resulting in no damage on the ground, despite the reality that Iran's nuclear facilities will have got hit hard with bunker busting cruise missiles, where further escalation would have suck Iran deeper into an unwinnable conflict that clearly Iran does not have the stomach for or capability for. Lets not forget that the Fourth Reich has murdered over 40.000 Palestinian civilians in implementation of Operation Hannibal, about half of whom are children.

This is the language of genocide, children are not deemed to be innocent. If they can do this to Palestinian kids then they can do this to any ones child! Literally hundreds of millions are at risk given that the Fourth Reich has over 300 nukes and is itching for an excuse to start using them!
“The war is not meant to be won, it is meant to be continuous. Hierarchical society is only possible on the basis of poverty and ignorance. This new version is the past and no different past can ever have existed. In principle the war effort is always planned to keep society on the brink of starvation. The war is waged by the ruling group against its own subjects and its object is not the victory over either Eurasia or East Asia, but to keep the very structure of society intact.”― George Orwell
The explains the Fourth Reich and the Iranian regime in a nutshell! And to varying degree every nation state, enemies are required for the masses to be effectively controlled. If one does not exist then create and foster it's intent and actions so that plans of genocide can be implemented under the smoke screen of self defence.

The bottom line is there is only one Empire and Israel is the tail that wags the dog, Iranians made the fatal mistake of forgetting this fact and believing their own propaganda and so paid a heavy price and now have to pretend that Israel never attacked and inflicted heavy damage on their nuclear facilities. If Iran had been intelligent then they should have pretended that the Embassy blowing up was just a gas leak instead of an Israeli missile attack which is the inherent flaw with dictatorships that they do not tend to be intelligent in their actions.
Still as I voiced in my market brief on breaking news of the Israeli attack that along with missiles it delivered a buying opportunity in target stocks Friday going into this weeks AI Tech stocks earnings season, an excuse to accelerate a trend that was already in motion.
S&P USD Correction
The S&P trend tends to be inversely correlated to the USD trend as this inverted chart of the USD illustrates, where what the stock market seeks is either a dollar trending higher or a stable dollar within a range.
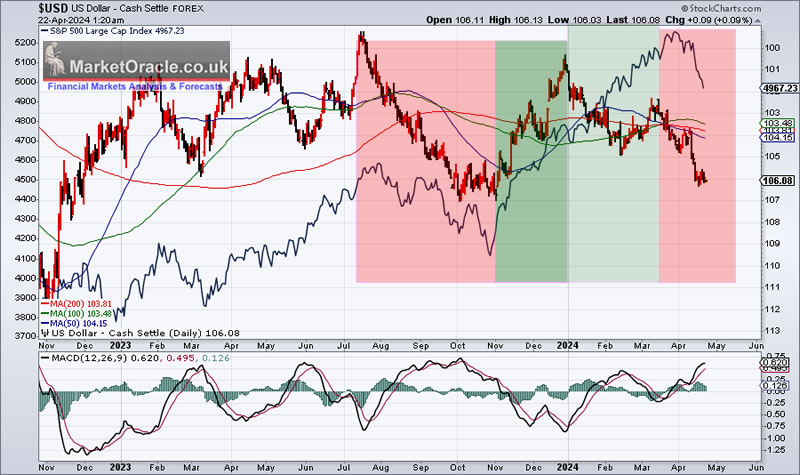
USD is targeting resistance at $107 that should contain it's rally that suggests whilst stocks are trending lower, that unless the USD breaks to a new high above $107 then most of the decline is behind the S&P i.e. a case of carving out a bottom whilst the USD carves out a top. The MACD also suggests that USD is going to find it sticky in the $105 to $107 range just as it did during last October. So we are seeing a normal correction in the stock market that was clearly in FOMO mode during March that finally snapped going into April.
So further dollar upside should be limited, i.e. looking at GBP at $1.234, I can see perhaps another cent lower to around $1.22, so an opportune time to exchange USD for GBP vs $1.29 where it was trading a few weeks ago.
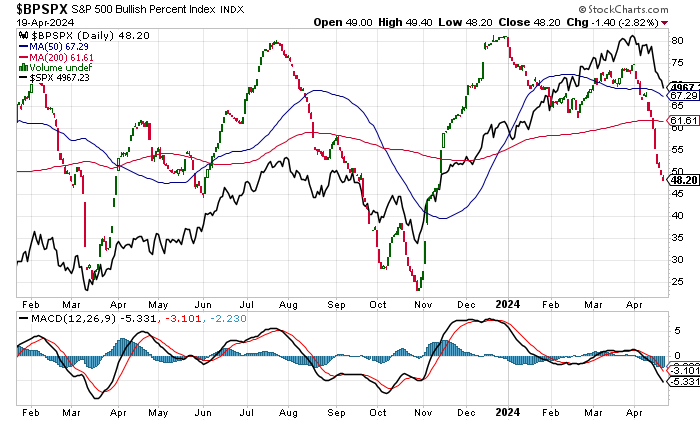
Stock Market Sentiment
In a very similar pattern to the US Dollar, we had negative divergence in the bull bear % spread going into the end March S&P top which at 48 does not have far to go before it enters into an over sold state below 30, again suggesting that most of the decline is behind us. Remember we are in a bull market so bearish readings are going to be infrequent and short lived.
Stock Market Trend Forecast 2024
As I voiced in my preceding analysis that failure of the Feb to March correction results in the following consequences -
a. It increases the probability for the other 2 corrections to materialise i.e. it was always a toss up whether we see 2 or 3 corrections during the year, where 2023 saw 2 corrections and thus tipped it in favour to expect 3 for 2024.
b. That failure of the Feb / March correction brought the May to June correction forward into April as illustrated by the original trend forecast.
S&P Stock Market Analysis, Detailed Trend Forecast Jan to Dec 2024
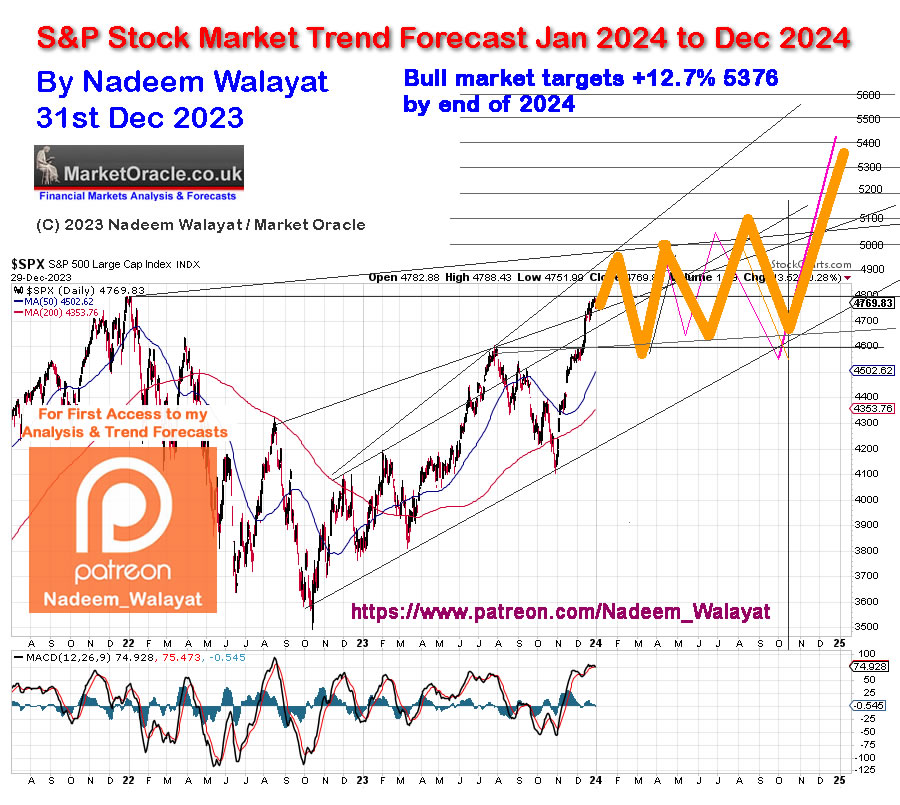
My original expectations are for the 2nd correction to begin Mid April and to run into Mid June. Where the failure of the first correction brought the correction forward to the start of April, though truth be told I have not been focused on the what the S&P has been doing instead seeking to capitalise on the mini mania under way in tech stocks with significant trimming of most holdings on a case by case basis where the last big sell was of LRCX at $960, reducing my position down to 20% invested of target exposure. Note exposure is hard cash invested which the act of trimming and re buying reduces down towards zero, though obviously one needs to have the mini FOMO's to trim into. So the reality is the stock market indices entering into a correction early April IS as per forecast despite the fact that many tech stocks such as AMD entered into their corrections several weeks earlier. Where the trend forecast is for a 2 month correction that will likely terminate early June for a bull run into Mid August as forecast.
The S&P triggering points are 5140 to target 5060 (done), 5060 to target 4960 (done) and a break of 4960 to target 4800 which should be the direction of travel for a basing pattern between 4860 and 4760.
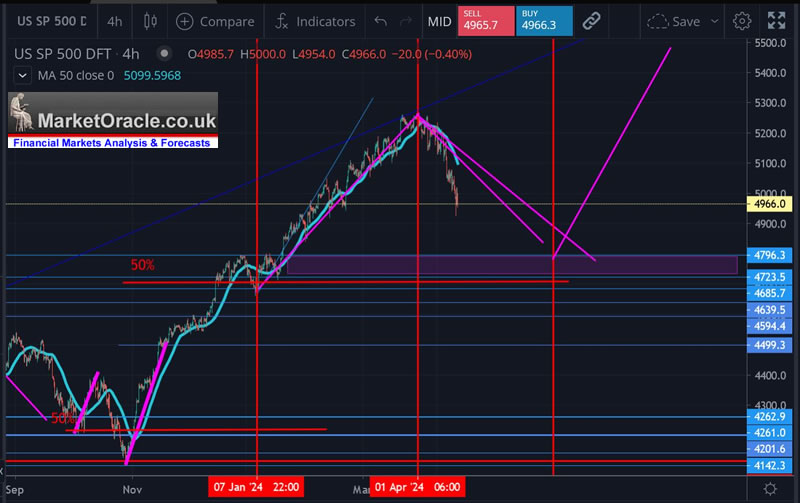
Whilst my forecast is for 5376, however as I indicated in recent analysis I would not be surprised by overshoot to the upside that sees the S&P trade as high as 5600 this year.
The big picture remains for a multi year bull market off of the October 2022 low, so folks sat on the sidelines have missed 18 months months of a bull market! Just think about that for a moment! They have been sat on parked in money market accounts because they paid attention to the likes of clown cramer and the cartoon network! 18 months and they are going to increasingly become desperate to get on board the gravy trains, everyone wants to know when the bull market will end, I can guess and say we are probably at the half way mark though that does not mean it will end late 2025, it's too far away in terms of time, all I know is we have a lot further to go.
Tesla Robo Taxis are Coming THIS YEAR!
I've covered Tesla at length over the past couple of years, promoting it to primary AI due to developments in it's AI and robotics divisions which has been manifesting itself in FSD updates that have long promised to turn every Tesla car into a fully self driving car, a defacto robo taxi! With the release of FSD 12.3 that future is just a mere months away as Musk tweeted.

Most Tesla cars are capable of full self driving, think about that, there are 6 million Tesla's out there most of which are capable of self driving even of the customer did not buy it when they bought the car with Hardware 3 and 4 computers.
So there are already millions of potential robo taxis out there! And what does that to the value of the cars? X2? X3? And so should the stock price as Tesla montizes FSD through price hikes and subscriptions.
Implications are that there will be LESS cars on the roads, why buy a car when one can ride a robo taxi as the price of the FSD cars soar so will car ownership become a luxury rather than a necessity which will mark another step on the path towards YOU WILL OWN NOTHING, not even a car! We are literally knocking on the door of UBI!
At the end of the day FSD / robo taxies will make economies more productive.
And as is always the case I put my money where my mouth is, now 129% invested in Tesla of target having rapidly accumulated in advance of the emergence of the bot armies, now 2.8% of my portfolio, where the biggest mistake one will likely make is to trim too much too early because the Tesla stock price is destined to x10. I know people want to hear nice round numbers like x10 in 10 years, but time depends on the pace of developments which given the AI mega-trend is exponential, so my best guess is for Tesla to x10 between 4 to 7 years, it all depends on how fast things go, the steepness of the parabola, hard to determine before the fact but easy to see with the benefit of hindsight some years down the road.
How to Further Capitalise on the Robots
Apple scraps electric cars for robots!
Amazon has over 800,000 robots already deployed directly displacing 100,000 human workers.
Luckily we are already heavily investing in the primary robotic companies set to capitalise on this mega-trend such as Tesla and Nvidia that is powering AI with it's latest release the Blackwell GPU's relabeled as AI accelerators.

Even sleeper Intel is part of the coming Robot storm set to obliterate the biggest market of them all that for human labour!
At this point the two key robotics companies are Tesla and Nvidia,
The key element most people don't grasp is the speed at which AI robots learn and improve compared to humans which on average take a good 20 years before they can become productive, with robots its learn once apply to all and network cloud improvements downloaded in real time.
Apart form that we have the 4 funds, of which INTL, RBTX and SMH are heavy in robotics and AI. SMT is higher risk as it has demonstrated itself to be in terms of stock price trend! Thankfully it has long since left it's $6 bottom behind behind trading at $8.52 which allowed one to trim from over exposure, so even that disappointment is coming good.
Today's clear robotics priorities are -
1. Nvidia
2. Tesla
3. Amazon
Whilst the others such as Apple, Google and Microsoft have yet to show something of substance.
What about Boston Dynamics?
Once owned by Google, sold on to soft bank who sold it to Hyundai. Promised so much for so long but to date just produce videos of robots doing tricks. Hyundai stock has been stuck in a trading range for some 20 years, currently trading towards the upper end of this range. So it's basically a dividend range trading stock. The Boston dynamics division is a mere pinprick in terms of generating revenues and is nowhere near generating a profit.
Understand the clowns on Wall Street that do the rounds on the likes of the CNBC cartoon network don't have a clue what is going on, all they do is focus on quarterly results, if a company beats it gets bid higher, if it disappoints it takes a tumble, there is little comprehension of the AI Mega-trend, only that they often get caught sat on the sidelines as they watch the likes of Nvidia soar into he stratosphere or worse SHORT convinced by their voodoo that a stock like Tesla is going to go broke!
AI Stocks Portfolio Accumulate and Distribute
Several more target stocks have entered their buying ranges - TSMC, ASML, Apple.ALB, CRUS, JBL, GPN to join the likes of AMD, ADSK, GFS and TSLA.
The key metrics to watch are the buying ranges and deviations from all time highs i.e. AMD is well within it's buying range and is trading at -36% deviation from it's all time high set just a few weeks ago! As well as now no longer trading above 100% of it's PE range unlike META.
https://docs.google.com/spreadsheets/d/183aPw1ztElfFT9c2Ch9vKk1uL3LTGiEaNsM6vaHxDQM/edit?usp=sharing
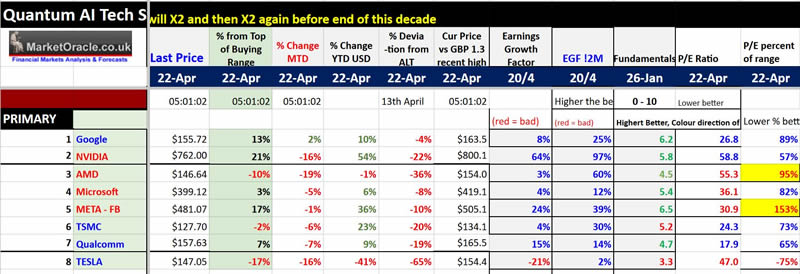
Here's how I quickly read where the opps are using the Spreadsheet.
Where the Primary stocks are concerned right now where are the opps to accumulate? What stands out?
1. Tesla -75% of PE range, -65% from ATH, -41% YTD, -17% from top of buying range. EGF is negative at -21% but one can't get an opp without there being bad news.
2. Nvidia 57% of PE range, -22% from ATH, -16% MTD, Eye watering strong EGF's, currently Nvidia is at it's cheapest valuation since it blasted off May 2023. The stock price broke below support at $800 and looks destined to trade under $700 to target $600 which would represent a whopping 40% deviation from it's recent ATH. Key milestones along the way will be for a break below $750, $700, and $660 on route to $600 to enter it's buying range of $628 to $496. At this point I suspect the stock will find strong support at $700 given that so many have been waiting to buy Nvidia, that and the earnings are a month away on 22nd May, still $700 will deliver a 30% deviation from the high.
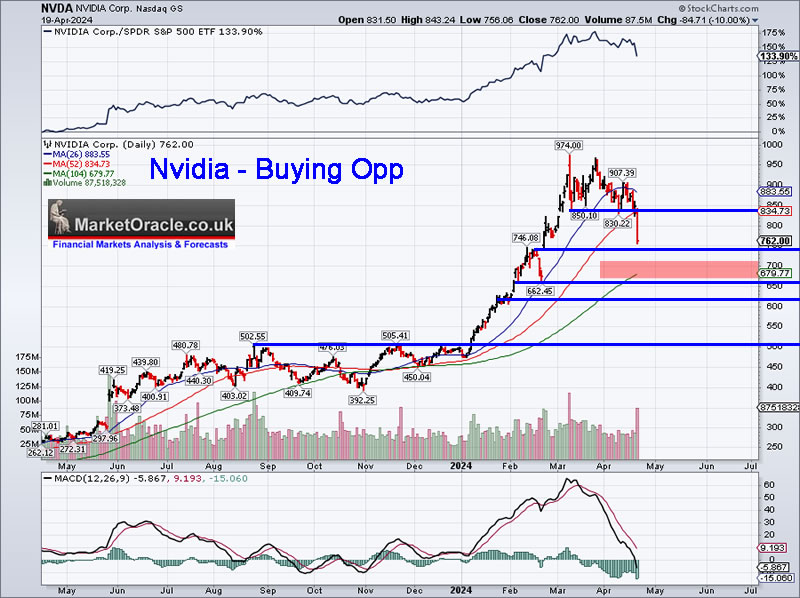
(Charts courtesy of stockcharts.com)
3. TSMC 73% of range, -20% ATH, -2% below top of Buying range. Positive EGFS, Presenting an unfolding app to accumulate at $128 vs near $160 a month ago..
4. AMD 95% of PE range, -36% ATH, -10% below to of buying range that extends down to $136, Positive EGFS, only a few weeks ago AMD was $228 now $146! I trimmed heavy in the run up to the high so have had plenty of scope to reaccumulate. Imagine selling at $210 and buying back at $150, that's an effective buying price of $90 vs those who just DCA / buy and hold, that's how ones position becomes FREE over time which it can never be if one just buys and holds. This is why it's pointless to look to sell the tops or buy the bottoms, the only prices that matter are the spreads between where one sold and where one re bought, even selling a chunk of AMD at $195 and buying back at say $155 results in $40 erosion in ones average price paid per share, so an original $90 buy now becomes $50 for those shares, all without trying to sell the top or buy the bottom. The only thing that matters is that you never sell at a loss. Never do something stoopid like Sell META at $100 because you think you can invest in something better because Clown Cramer says it's finished. That's how to wreck your portfolio!
Just before the dump I sold a large chunk of LRCX at $960, current is $870. So say if it continues to correct down to $760 and I bought back what I sold then I will have lowered my average price paid for those shares by $200, so say I originally bought at $600 which would then become $400. It does not matter where the individual buys are as we will only know THE low in hindsight, the only thing that matters is that I am buying back for less than where I sold.
As I often say there is no easy money, you have to work for it. People want it easy, bung it in an S&P ETF, play around with the numbers to pretend they are getting a higher return than what they are, all you'll get in the S&P is 8% per annum. My objective is not really focused on return, it's more focused on driving down the average cost per share to ZERO via trimming and reaccumulating, so what if I bought AMD at $165, and more at $155 and even more at $145, these rebuy's are still a lot less than where I sold a few weeks ago.
The above current real time examples illustrate how it's done in practice. For instance Tesla's fallen to $147 thus prompting over exposure to 129% invested of target, there'll come a time when Tesla is trading at $400 by which time I will have trimmed down to probably under 90% invested, what will be the average cost per share? Probably a lot lower than $147. I already did this last year when I bought the dip all the way down to $100 and then trimmed about 80% of what I bought on the rally to $300.
Though don't make the mistake of over trimming and then be sat 90% in cash! I keep a close eye on the total percent invested as I want to aim for my portfolio to be around 80% invested so as to capitalise on the underlying inflation mega-trend. The rich don't sell assets, they are constantly adding more because they tend to take things to the next level by BORROWING against their assets i.e. leverage. So in effect never sell and thus don't trigger taxable events with the objective being to pass on their assets to the next generation. Meanwhile Joe blog's is spinning his wheels by selling good stocks for 10% or 20% gains or worse taking a loss during a draw down and then sat mostly in cash which is constantly losing it's value.
So one should not fear falling prices because -
a. They might not fall!
b. That any fall will be temporary
And thus the REAL RISK is NOT to be INVESTED in good stocks. Instead be parked in cash losing value.
You already do this via the mortgage on the home you live in, borrowed against an asset that you have no plans to sell.
Q1 Earnings Season
The way I play earning season is to have my buy and sell limit orders already in place, I rarely sit and watch the markets trade as one is going to be focused on just one market at a time, for instance watching AMD for an hour or more trying to gauge when to hit that buy button when all one needs to do is to put a series of limit orders in place to ensure at least some get triggered. For instance right now with AMD at $147 I have small limits to buy at $144.3, $141.6, and larger buys below $140 at $138.6, at $135, collectively about 3% in terms of impact on exposure. Whilst my nearest small sell is at $184. The lower AMD goes the more buy limit orders I add, the higher it goes the more sell limits I enter all with an eye on exposure and total position size as a percent of portfolio as I still want to retain AMD as one of my largest holdings, currently ranks as 3rd largest after META and Google.
TSM - $127.EGF +4%, +30%, PE 24.3, PE Range 73%
Once upon a time TSMC was the weakest of the primary AI tech stocks, a case of marking time before it has it's blast off moment, in fact in my Mid Jan article with TSMC trading at $100 I wrote that it would soon target $120 and then $140 which is why i was 100% invested at the time, well it achieved those targets and more! Rocketing higher to $158! Which prompted me to trim down to 60% invested. Now despite a good earnings report we are well into a correction that saw the stock trade down to $126 Friday.
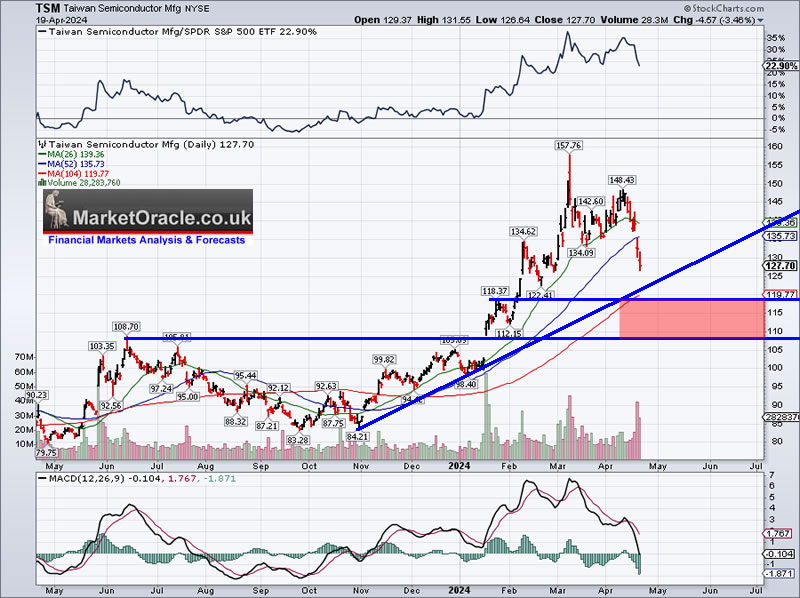
The earnings report was good but the 60% rally was well beyond fundamentals though the drop from $158 to $127 has deflated much of that overbought state. So whilst further downside is likely into the $120 to $110 support zone, TSMC is now in it's buying range of $130 to $118 and hence I have been reaccumulating.
The Bottom line is that TSMC remains a good primary AI tech stock that got carried away with FOMO which is now dissipating.
Tuesday 23rd April.
TSLA - $147 - EGF -21%, +2%, P/E 47, PE Range -75%
Tesla announced 10% of it's global workforce is getting fired which should lower costs and pave the way for the bot workers. Tesla is a sleeping AI giant, you see why when one marries Tesla bot's with AI trained on their in house neural net DOJO supercomputers and what you get are walking talking working robots that I suspect will arrive within the next 18 months. Therefore I have remained primed to capitalise on this years buying opportunities in what now is a primary AI tech stock. The EGF's have been weak all year so continue to suggest earnings disappointment and therefore price drops, which is what I warned to expect January when the stock was trading at $220 and the only thing that has changed is that Tesla is now $70 cheaper.
(Charts courtesy of stockcharts.com)
The buying range did it's job prevented FOMO-ing into the top, instead to bide ones time until under $200. Back in January I warned that Tesla could fall to $150 which would be time to load up the back of the truck, at that time I was 56% invested, today the truck is fully loaded at 129% invested, so further buys will be painful but ones best buys always tend to be the most painful to do! For those looking for the bull market to resume would need to see Tesla break above $185, until then it is stuck in a trading range of $185 to $150, currently dipping below as it follows the herd lower. A break above $185 would target a trend to $300+ this year.
RTX $102 - EGF +2%, +356%. PE 20
RTX bottomed about 2 days before Oct 7th, methinks someone had some inside info on what was coming! There was a lot of buying on that Friday before Saturdays event, Rothschild's modern day versions of their pigeons!
Back in January with RTX trading at $86 my expectations were that it would trade to $100 this year, that target has been achieved. RTX is a steady as she goes slow growing defence stock that pays a 3% dividend along the way.
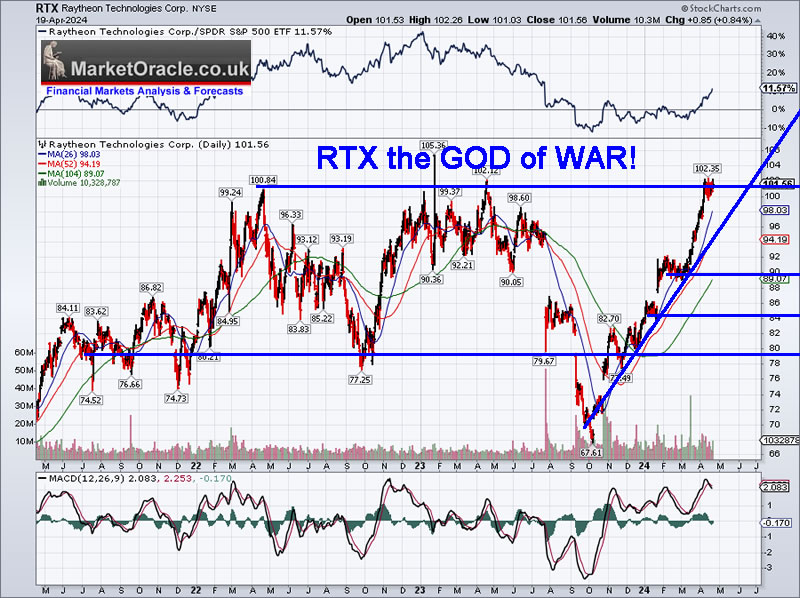
RTX is now at the top of a multi year trading range which has prompted me to trim it down to 20% invested. I am positioned for RTX to follow the herd lower and correct down to first $90 and then $84. With the risk being to the upside i.e. that it blasts through resistance on more WAR WAR.
Wednesday 24th April
META $481 - EGF +24%, +39%, PE 30.9, PE Range 153%
META releases Llama 3 open source LLM. META has had a spectacular bull run and refuses to retreat despite being over extended i.e at 153% of it's PE range, the reason for this can be seen in it's high EGF's. It's going to take a lot more than a war in the middle east to knock this stock lower!
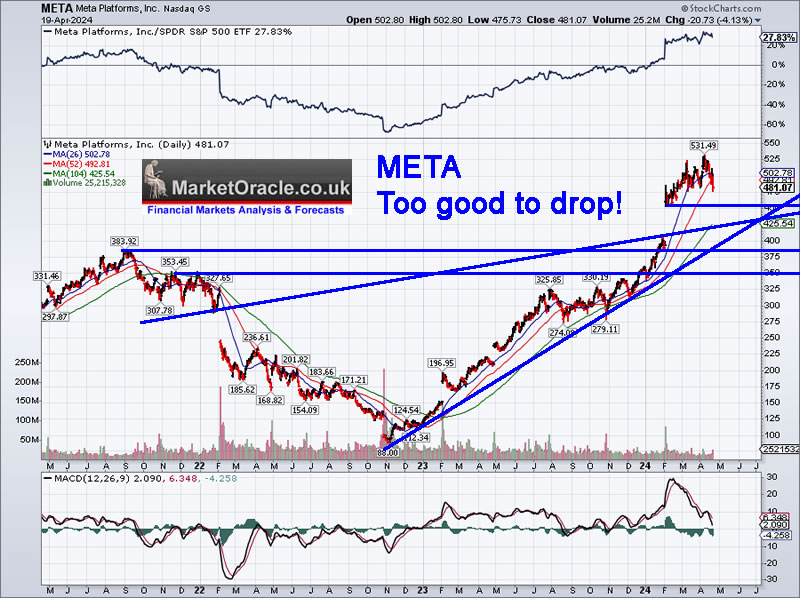
The stock chart has a gap between $450 to $410 that all who are waiting to buy are banking on getting filled. But as one can see from the MACD META has been unwinding its overbought state without actually dropping in price. Every time the stock looks like it's going to take tumble it does an about turn higher to back above $500. It is one of the best AI tech stocks to be invested in and I have to mention once more than Clown Cramer stated that it was finished at $100! And now AFTER a 5x the clown sings META'S praises! I have trimmed META down to 44% invested but despite this it is still my biggest holding! It's proving too good to drop, META falling to even $400 would be getting lucky. It's probable eventually going to do what it did after it traded side ways along $300 last year. So if one is going to be heavy in any stock META would be one of those stocks.
IBM $181 - EGF +14%, +7%, PE 18.9, PE range 337%
IBM a sleeping dinosaur that most had given up on took off like a rocket during the year, went straight from $150 to $200 before correcting. EGF's are good, PE of range does not matter much given that the sleeper has awakened and likely to move into a new higher PE range, where the PE of 18.9 is not overly expensive compared against other AI stocks.
(Charts courtesy of stockcharts.com)
Back in January with IBM trading at $165 I stated that IBM was going to the Moon, $200! And well it happened! Initial target for the correction was $180, on break below targets $160, which is about as deep as one can expect it to go. After heavy trimming I stand at 27% invested and will add more as it falls to $160. The bottom line is that $200 is as good as it gets for some time for this slow growth AI tech stock that yields 3.7%. So it was never going to do an Nvidia, still it has broken out and thus is in a bull market that given the FOMO moon shot should now resolve in a correction to $160 or better.
Lam Research - $870, EGF +8%, +16%, PE 31.8, PE Range 173%
Lam Research near doubled off it's October 2023 $572 low, so no matter how good the stock is by $1000 was very over extended as illustrated by the high PE of range, that despite falling to $870 is still over valued. However EGF's remain positive thus LRCX continues to grow earnings so over time will justify a high price.
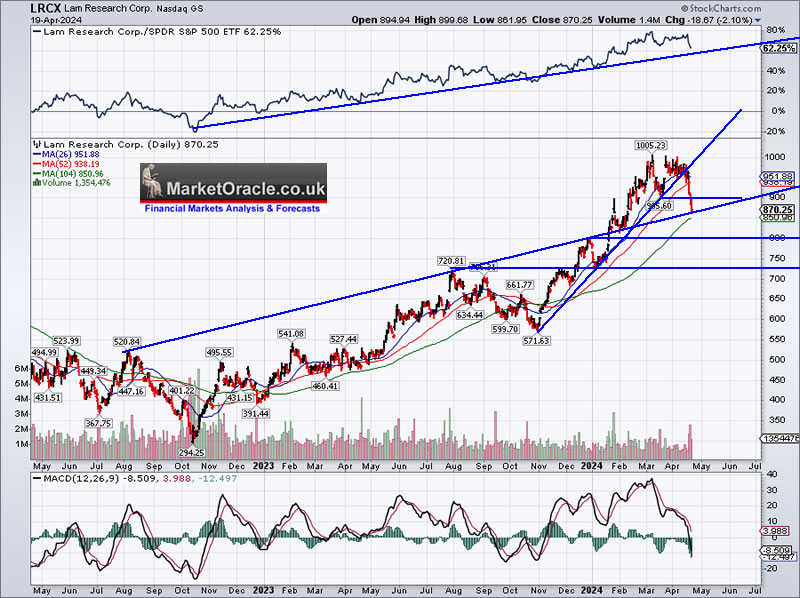
(Charts courtesy of stockcharts.com)
Despite falling to $870 I suspect LRCX has further to fall, likely to below $800 and could trade all the way down to $720. I heavily trimmed LRCX with my last big sell well timed at $960 last week and thus I have already lightly started accumulating so as to increase exposure from current 20% invested. Bottom line LRCX has stable earnings growth but has experienced a lot of FOMO that should see the stock price trade to under $800 for deeper opps to accumulate.
Thursday 25th
Google $156 - EGF +8%, +25%, PE 26.8, 89% of PE Range.
Google continues to fight a rear guard action against Open AI / Microsoft Chat GPT, releasing Gemini 1.5 after Gemini 1.0 turned out to be a woke joke. The google stock price has literally climbed a wall of worry, virtually every week there is bad news for why Google is going to soon die, what does the stock price do? Trades to a new all time high! The metrics paint a picture of a stock that is set to steadily coast to $200 this year. It is what it is Numero Uno, not noisy and volatile like AMD or Nvidia. I mean AMD is down 36% from it's ATH, Nvidia 22%, Google just 4%. Keep Calm and carry on trending higher is the message from Google, hence it is my second largest position.
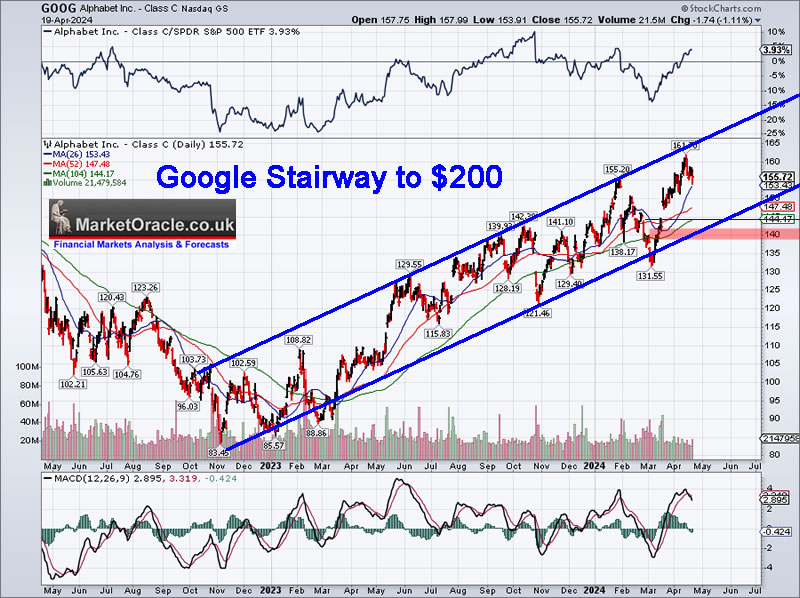
The stock price is literally climbing a stairway to heaven ($200). Current bottom of the range intercepts between $144 and $138 to just touch the top of it's buying range of $138 to $124. Realistically it's going to be a case of getting lucy to see Google trade down to $138, let alone any lower than that as some talked themselves into to expect when Google was trading at $135 early March, that WAS your buying opp as I warned at the time that next stop was $160 not $120. I will add a little more Google sub $140, playing the Trim and Rebuy game to shave away a few cents from the average price paid per share. Those wanting to build a position should not wait for sub $140, instead look at $148 to start accumulating.
INTEL $34, EGF R29%, R62%, PE 34.2, PE Range 1300%.
Intel continues to pay the price for bad management and under investment that it is seeking to fix via a string of new foundries across the world that will take time, several more years to materialise especially for cutting edge chips. There is no good news in the fundamentals which could result in a surprise to to upside on news that is not as bad as expected. With Intel it's a case of playing the long game, it's a disappointing stock that was showing signs of coming alive when it briefly surged above $50 during AI FOMO, an opp to trim over exposure since which the stock price has literally melted just as it's over heating processors tend to do.
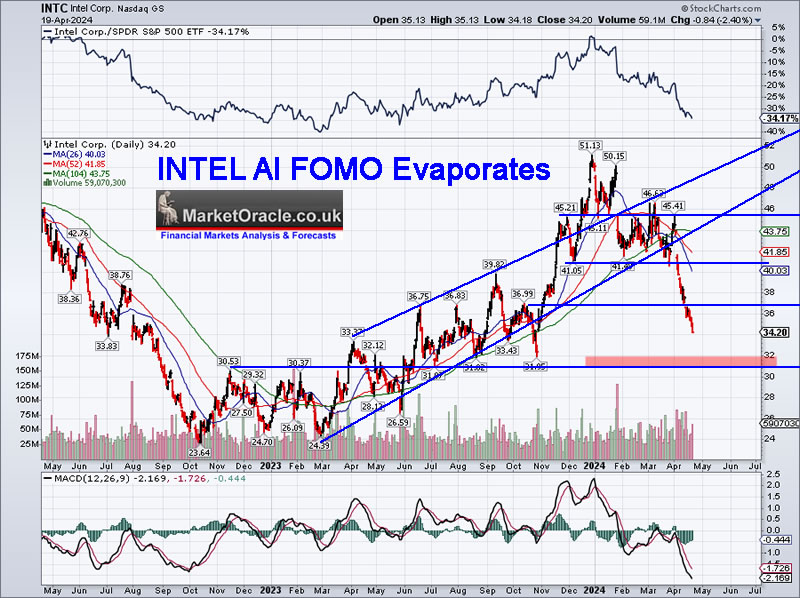
The stock price continues to break support $41, then $37, next $34, probably set to trade down to $32 which should offer some sort of a floor. So those eager for more punishment could eye $32 as a place to accumulate. Intel is now going to find it tough to break back above $42, given all those who got suckered into the AI FOMO between $42 and $50. Still you never know Intel could pull a rabbit out of the hat on earnings if Gelsinger says AI enough times the stock could catch a bid. The fact that it did manage to FOMO to $50 on no news means it could do it again and more for another trimming opp, so it is not as bad as it could be given the metrics.
Microsoft $399 - EGF's +4%, +12%, PE 36.1, PE Range 82%
The AI War is accelerating. Microsoft announces plans to spend $100 billion on "Stargate" Open AI Super computer. Microsoft's annual free cash flow is $25 billion, total capex last year was $28 billion so would need to print shares / borrow money to fund it's super computer. Also the deal with Open AI is crippled to sub AGI which means Microsoft won't be able to capitalise on AGI which as far as I am concerned we are on the cusps of so Stargate sounds more like a panic measure than something that can actually pay off.
Of all the stocks Microsoft has been the hardest to accumulate into, in relative terms it has never given much of a buying opp, i.e. late 2022 why buy Microsoft for $250 when one can get META for $100. Microsoft remains expensive today in relative terms i.e. why buy Microsoft when one can buy TSMC or AMD, even Nvidia is looking better value buy than Microsoft. This chronic over valuation has resulted in under performance when compared to what the other AI stocks have done this year, in fact Microsoft has under performed the S&P since the November 2023.
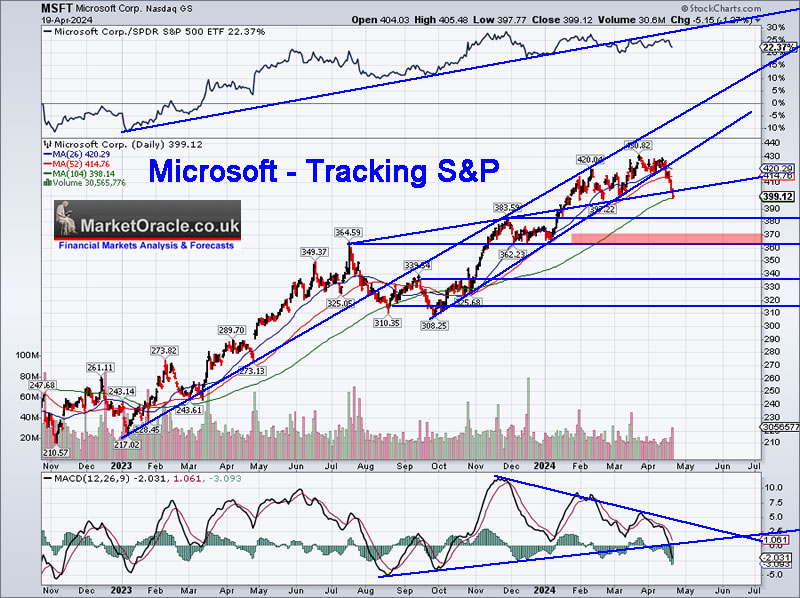
(Charts courtesy of stockcharts.com)
The stock is off it's $430 high, trading at support at $399 that should resolve in a continuation of the downtrend to under $370 targeting $360. Therefore $370 to $360 would be as good as one can expect it to get in terms of accumulating MSFT for the long-run whilst the buying range of $386 to $366 acknowledges the fact that MSFT does not tend to give much of any buying opps i.e. $386 would be -11% off it's ATH, a case of better something rather than nothing.
KLAC $628 - EGF's -2%, +9%, PE 19, PE Range 164%.
KLAC recently migrated from Medium risk to Secondary AI, is another one of those good stocks that rarely gives deep buying opps even off overbought states, instead tends to unwind overbought states via earnings growth. The near term EGF is weak at -2%, and coupled with 164% of it's PE range offers the possibility of an earnings miss that could send KLAC to below $600 to target $550 for a 25% deviation from it's high.
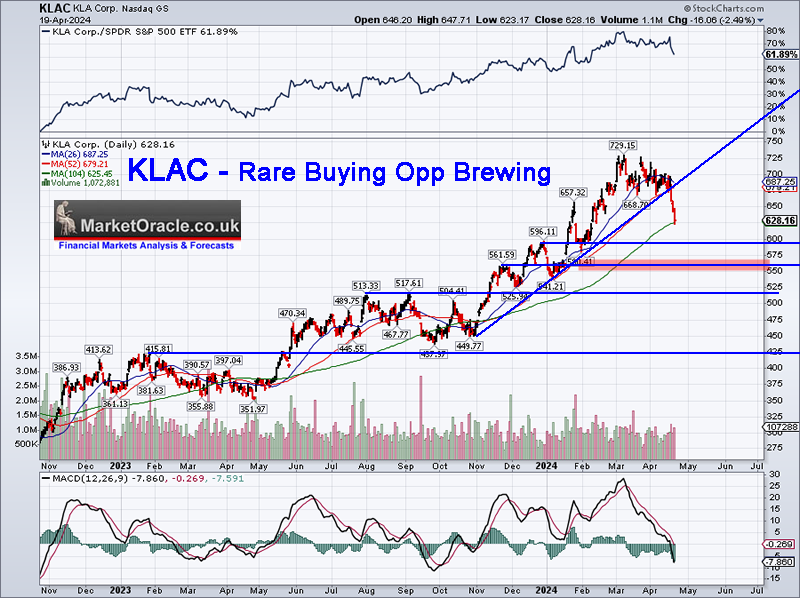
The good news is that KLAC is finally giving a decent opportunity to accumulate in terms of deviation from it's high which in percentage terms looks set to be on par with that of the Sept to October 2023 drop, targeting entering it's buying range of $592 to $528, so I will definitely be seeking to capitalise on the drop having trimmed my position down to 33% invested. KLAC will likely trade below $600 to target $550, it's going to be tough to expect much lower than that especially as the MACD is near completing unwinding KLAC's overbought state.
WD $66, EGF's -83%, -154%, PE -11
WD FOMO 'd to the moon! Prompting heavy trimming down to 44% invested. Now it's time to pay the piper as I am not seeing the reason for the bullishness in the metrics but clearly there is a lot of discounting of the future going on so the trend should not be taken lightly i.e. it is a harbinger for future earnings growth but the fact that it is yet to materialise is going to result in a lot of volatility i.e. the stock price is flagging to expect earnings surprise, big losses turning into big profits, though if they don't materialise watch out below!
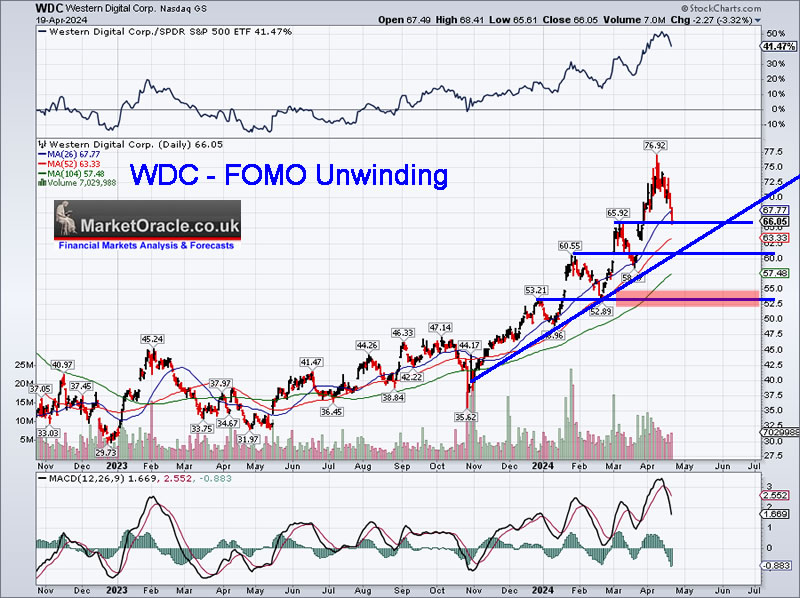
WDC topped at $77 in a parabolic run higher, unless it delivers a big earnings surprise I suspect it will trade back down to the $55 to $50 range which would bring it into it's buying range of $54 to $46. I'll probably start accumulating around $61.
Tuesday 30th April
AMAZON $175 - EGF's +30%, +68%, PE 62 , PE Range 69%
You want to know why Amazon has been relentlessly trending higher? Take a look at the EGF's and PE of range. It took until Mid April before Amazon succumbed to a downtrend that had been underway in other stocks such as AMD for a month! Volatility into earnings could deliver a further opportunity where a break below $172 targets a trend down to $155 which coincides with it's buying range of $158 to $144.
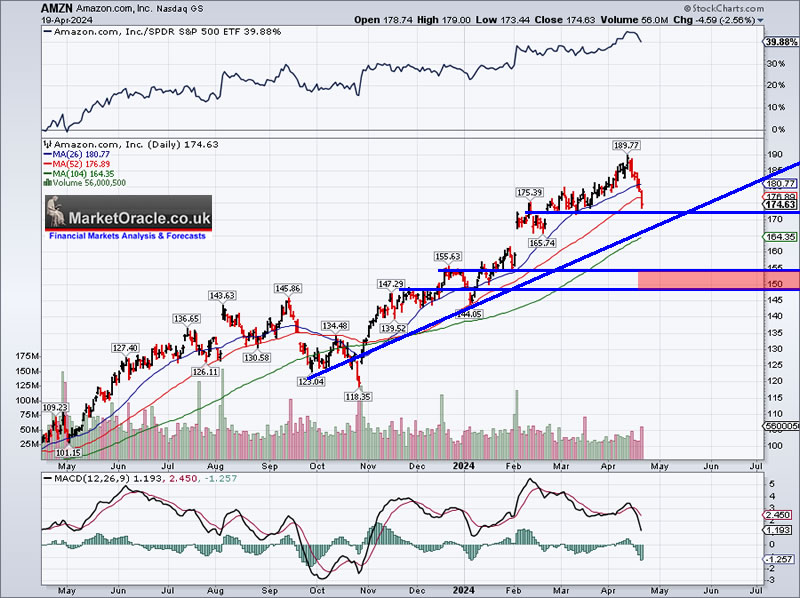
Bottom line is that Amazon has strong metrics that are improving over time and thus to see the likes of sub $160 will be a case of getting lucky.
AMD $147 - EGF's +3%, +60%, PE 55, PE Range 95%
AMD in it's race with Nvidia and to a lesser extent Intel will be releasing new Ryzen Pro AI chips to power AI laptops and PC's which at this point is more marketing hype than anything that folks should take much notice of i.e. rush to upgrade as where AI is concerned AMD is NOT superior to Nvidia, yes AMD CPUs are a lot better than Intel CPUs and their GPU's do offer some competition vs Nvidia GPU's but AI chips sounds like a sales gimmick i.e. something akin to an iGPU, a cut down GPU bolted onto CPUs that most app's won't make much or any use of. The only reason to buy AMD processors is because they are a lot better than Intel's, and that remains the case regard;less of AI marketing hype.
The EGF's are good whilst the PE and Pe of range remain a little elevated even after a 36% drop which illustrates just how nuts AMD's FOMO rally to $228 was that prompted me to reluctantly sell down to about 32% invested, since which time I had added about 13% back to stand at 45% invested.
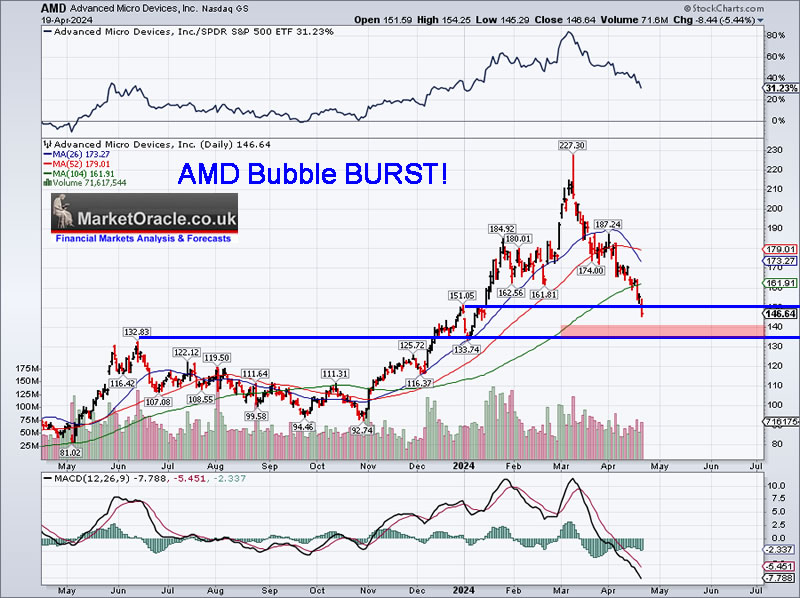
AMD had an epic FOMO spike higher to $228 since which has been down all the way, entering the buying range of $163 to $136, which started at 29% below the ATH, current price is 36% below the high so clearly most of the decline should be behind AMD. Whilst AMD is a very good stock it is NOT Nvidia so a PE of 55 vs Nvidia on 59 going into halving will still see investors selling AMD to buy Nvidia! AMD is now in strong support zone of $150 to $133 where the lower it goes the stronger the support becomes, at this point regardless of earnings mis or hit, I don't see AMD breaking below $133, that's not to say IF it does I won't seek to capitalise upon such a drop because AMD IS expensive when compared against Nvidia as illustrated by the EGF's and PE ranges and especially if Nvidia does continue to tumble to reach the likes of $600 which will prompt more selling of AMD to buy Nvidia.
The bottom line is all those who have been waiting for opportunities to buy target stocks are now getting those opportunities in some of the best stocks on the planet!
I'll cover later earnings such as for Qualcom and Apple in either a market brief or the next article.
Bitcoin Happy Thanks Halving
Bitcoin on cue trended lower into halving setting a new swing low on Friday at $59.6k before bouncing post halving, currently trading at £65k. Overall picture remains for BTC in a trading range of $72k to $60k pending a breakout higher probably timed with when the dollar turns lower.
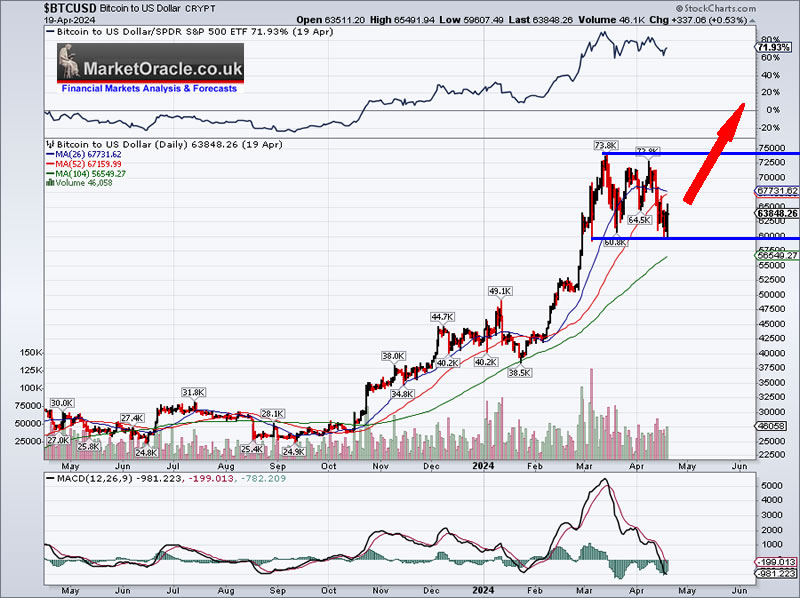
As per trend forecast to target $134k by late 2024 as my base case.
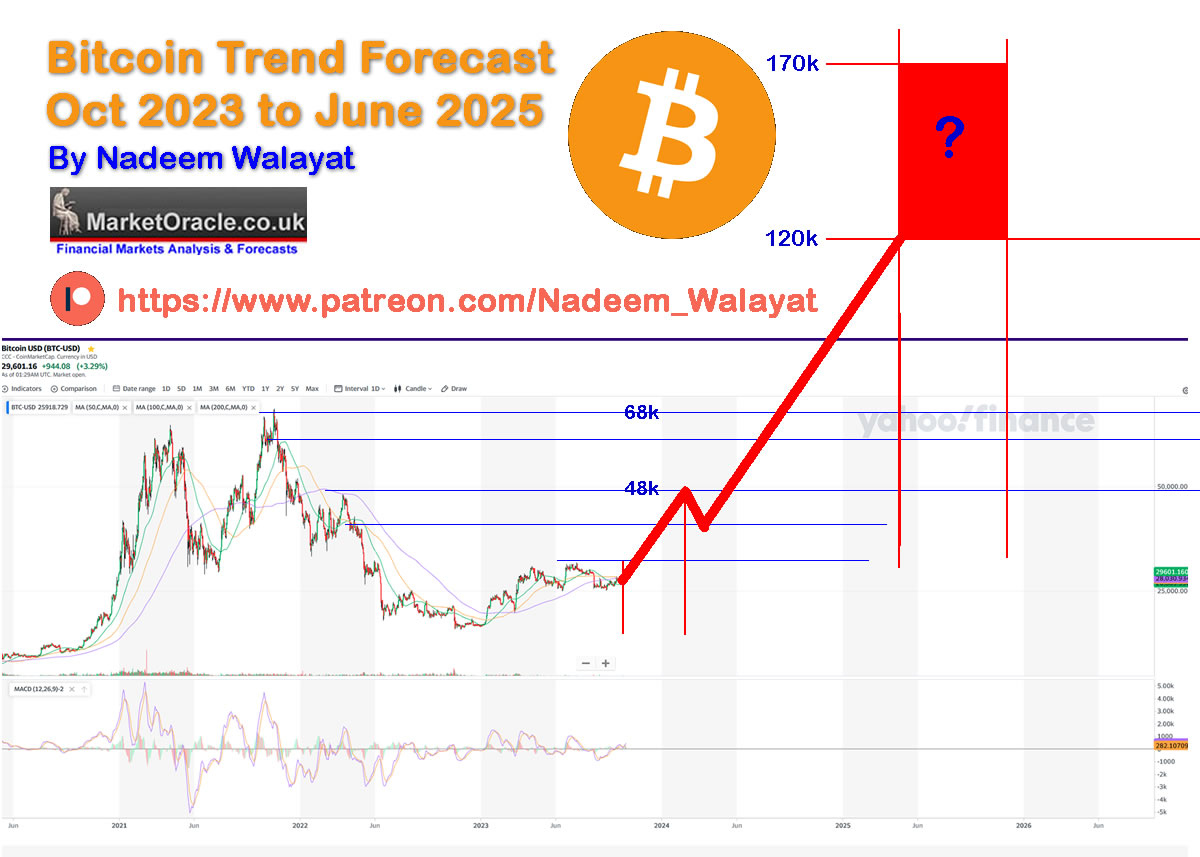
Bitcoin Trend forecast - Last Chance to Get on Board the Bitcoin Crypto Gravy Train - Choo Choo!
So here's my Bitcoin gift (trend forecast) that on the current price of $27k, Bitcoin will at least near X4 to $98k and likely a lot more than that, given that there will soon be a flood of Bitcoin ETF's hovering up limited supply of the NSA's, I mean Satoshi Nakamoto's crypto baby.
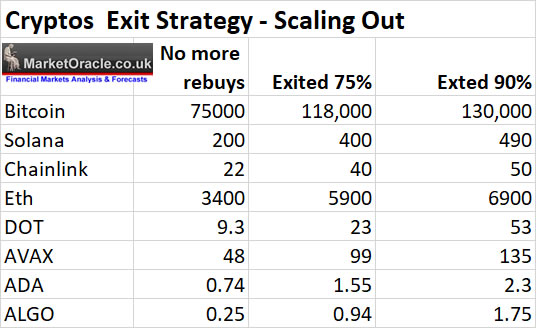
Crypto's Exit Strategy
Whilst here's a reminder of my crypto's exit strategy.
Next analysis will be focused on the housing markets
Your buying the dips analyst.
This article Stocks Correct into Bitcoin Happy Thanks Halving - Earnings Season Buying Opps was first made available to patrons who support my work. So for immediate first access to ALL of my analysis and trend forecasts then do consider becoming a Patron by supporting my work for just $7 per month, lock it in now at $7 before next rises to $10 per month for new sign-ups. https://www.patreon.com/Nadeem_Walayat.
And gain access to my most recent analysis - US Housing Market Analysis, House Prices Trend Forecast 2024 to 2026
CONTENTS
Stock Market Trend Forecast
US Stock Market vs M2 Money Supply
AI Stocks Portfolio
Nvidia 10 for 1 Stock Split
AI Computers Hype
2024 - AI Equals Loss of Agency
Why Alien Intelligence Cannot Predict the Future
Consequences of AI
UBI - Universal Billionaire Income
GLOBAL WARMING Housing Market Consequences Right Now
RECESSION When Yield Curve Uninverts
Global Debt Bubble.
IMMIGRATION DRIVES HOUSE PRICES HIGHER
US Housing Market Free Equity
US FIXED MORTGAGES LIMITING SUPPLY
HOA Nightmare
Florida Hurricanes
Rentals Crisis
Who is Buying All the Houses?
Commercial Property Capitulation
US House Prices Momentum
US House Prices Trend Forecast
US Housing Market Stocks
UK General Election - 4th July 2024
And access to my comprehensive 3 part How to Get Rich series -
Change the Way You THINK! How to Really Get RICH Guide 2023

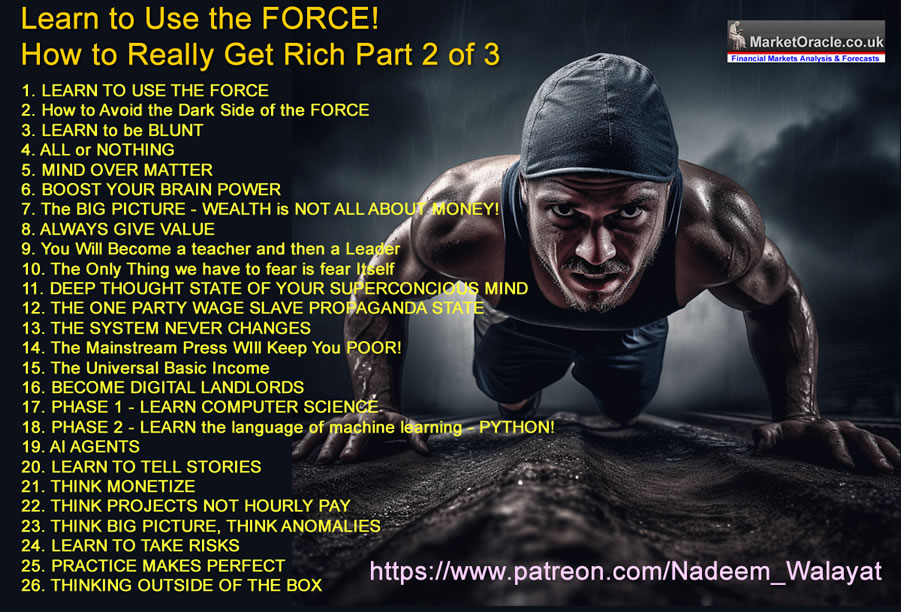
Learn to Use the FORCE! How to Really Get Rich Part 2 of 3
The Investing Assets Spectrum - How to Really Get RICH
Here's what you get access to for just $7 per month -
※ Patrons Get FIRST access to all of my In-depth analysis and high probability Trend Forecasts, usually 2 full months before the rest of the world. Notified by Patreon by email as well as posted on this page and I will also send a short message in case the extensive email does not make it to your inbox.
※Access to my carefully constructed and maintained AI Tech Stocks Portfolio that is updated on an ongoing basis, that includes on going commentary and a comprehensive spreadsheet that features unique innovations such as the remarkably useful EGF's.
※A concise to the point Investing Guide that explains my key strategies and rules
※ Regular content on How to Trade & Invest incorporated into most articles so as to keep patrons eyes on the big picture and net get too sucked into the noise of price swings.
※ Access to my comprehensive How to Really Get Rich series of articles, clear concise steps that I will seek to update annually and may also eventually form a Patrons only ebook.
※ Access to conclusions from my ongoing market studies from a total of over 200 conducted studies over the decades. updated whenever the market poses a question to be answered. Also enjoy the fruits of R&D into machine learning such as the CI18 Crash indicator that correctly called both the pandemic crash (Feb 2020) and the 2022 bear market (Dec 2021) well before the fact.
※Join our community where I reply to comments and engage with patrons in discussions.
※ I will also keep my Patrons informed of what I am currently working on each month.
※ Influence over my analysis schedule.
My objective is to provide on average 2 pieces of in-depth analysis per month and regular interim pieces of analysis as market briefs. So over a 12 month period expect to receive at least 24 pieces of in-depth analysis. Though my focus is on providing quality over quantity as you can see from the extent and depth of my analysis which I deem necessary so as to arrive at that which is the most probable market outcome.
So for immediate access to all my analysis and trend forecasts do consider becoming a Patron by supporting my work for just $7 per month. https://www.patreon.com/Nadeem_Walayat lock it in before it next rises to $10 per month for new signup's.
And ensure you are subscribed to my ALWAYS FREE newsletter for my next in-depth analysis.
Your crypto's accumulating analyst.
By Nadeem Walayat
Copyright © 2005-2024 Marketoracle.co.uk (Market Oracle Ltd). All rights reserved.
Nadeem Walayat has over 35 years experience of trading derivatives, portfolio management and analysing the financial markets, including one of few who both anticipated and Beat the 1987 Crash. Nadeem's forward looking analysis focuses on UK inflation, economy, interest rates and housing market. He is the author of five ebook's in the The Inflation Mega-Trend and Stocks Stealth Bull Market series that can be downloaded for Free.


 Nadeem is the Editor of The Market Oracle, a FREE Daily Financial Markets Analysis & Forecasting online publication that presents in-depth analysis from over 1000 experienced analysts on a range of views of the probable direction of the financial markets, thus enabling our readers to arrive at an informed opinion on future market direction. http://www.marketoracle.co.uk
Disclaimer: The above is a matter of opinion provided for general information purposes only and is not intended as investment advice. Information and analysis above are derived from sources and utilising methods believed to be reliable, but we cannot accept responsibility for any trading losses you may incur as a result of this analysis. Individuals should consult with their personal financial advisors before engaging in any trading activities.
Nadeem Walayat Archive |
© 2005-2022 http://www.MarketOracle.co.uk - The Market Oracle is a FREE Daily Financial Markets Analysis & Forecasting online publication.