


S&P 494 Stocks Then & Now
Stock-Markets / Stock Markets 2024 Jun 08, 2024 - 08:37 AM GMTBy: Submissions

One of the extraordinary features of today’s equity market is the extreme concentration of S&P 500 in a handful of names. Most readers know that stocks like Nvidia and Microsoft, the “AI plays”, essentially drive the performance of the S&P 500 and Nasdaq. We were interested in seeing the degree of market concentration at the last bubble peak in 2000. Historically, narrow market leadership portends future weakness in prices. So we did some quantitative work and put together some interesting charts updating our “S&P 495” chart series. We added one name, Nvidia, to create the Super 6 (Apple, Microsoft, Nvidia, Google, Amazon, and Meta), and compared these six to the remaining 494 stocks, the S&P 494.
The table below shows the top ten stocks in the S&P 500 both in 2000 and as of today.
S&P 500 Weights in 2000 |
S&P 500 Weights in May 2024 |
||||
Company |
Symbol |
Weight |
Company |
Symbol |
Weight |
Microsoft |
MSFT |
5.3% |
Microsoft |
MSFT |
7.0% |
G.E. |
GE |
3.5% |
Apple |
AAPL |
6.3% |
Cisco |
CSCO |
3.1% |
Nvidia |
NVDA |
6.2% |
Exxon |
XOM |
2.7% |
Alphabet |
GOOGL |
4.2% |
Intel |
INTC |
2.4% |
Amazon |
AMZN |
3.7% |
Citigroup |
C |
2.4% |
Meta |
META |
2.3% |
IBM |
IBM |
2.4% |
Berkshire Hathaway |
BRK |
1.7% |
Oracle |
ORCL |
1.8% |
Eli Lilly |
LLY |
1.5% |
Home Depot |
HD |
1.6% |
Broadcom |
AVGO |
1.4% |
Merck |
MRK |
1.4% |
JP Morgan Chase |
JPM |
1.3% |
Total |
|
26.5% |
Total |
|
35.6% |
The first observation is that the concentration in 2000 is significantly smaller than the concentration today. The top ten stocks weighed 26.5% in 2000 versus 35.6% today (we count Alphabet’s two listings as one). Drilling down to the top six index holdings, which we’ll study below, the divergence is even greater. In 2000, the top six S&P 500 stocks accounted for 19.4% of the index. Today, the Super 6 are just shy of 30% of the S&P 500.
While concentrated markets and narrow leadership have tended to be ominous for markets, we look back to the Tech Bubble period to see whether (1) we have comparable degrees of market concentration today, (2) how performance differed between the top holdings and the remaining 494 stocks then and now, and finally (3) observe the aftermath in 2000 from the peak of market concentration.
We take a five-year runway for our performance charts today and started our data series five years prior to the 2000 market top.
The first chart shows the Super 6 in red (Microsoft, Apple, Nvidia, Google, Amazon, and Meta, using their current weightings in the S&P 500) against the remaining 494 S&P 500 stocks in blue. We put both price curves, rebased to 100 in 2018, on the same scale to see the performance differential.
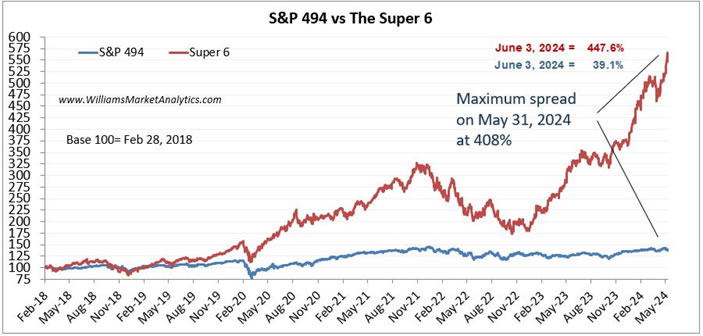
Since 2018, the Super 6 are up almost 448%. If one had invested in the S&P 494, the gains would have been a paltry 39%. The cumulative difference stands at +408% in favor of the Super 6.
The next chart shows the S&P 500 (in red) price index against the S&P 494 (in blue). The S&P 500 with mega cap tech stocks really began to diverge post-Covid. The gap closed in the 2022 correction/bear market but has since reaccelerated to its widest point today, the AI hype evidently fueling the Super 6 relative performance.
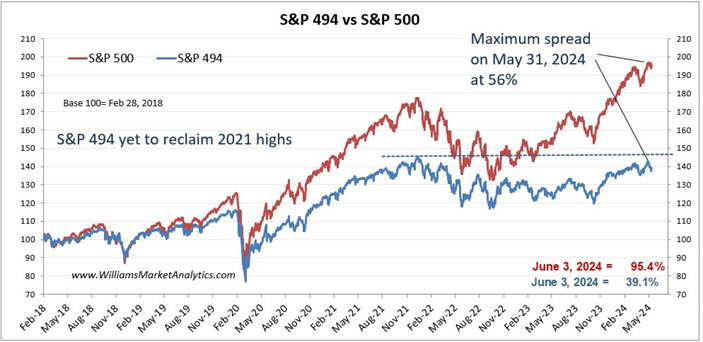
Currently the gap between the S&P 500 and S&P 494 is at +56%, wider than at the late 2021 market highs. Importantly, note that an investor who bought the theoretical S&P 494 in late 2021 is still underwater.
The next chart goes back to the run-up to the Tech Bubble peak. We take the top 6 stocks of 2000 (Microsoft, General Electric, Cisco, Exxon, Intel, and Citigroup), again representing 19.4% of the S&P 500 index in 2000, and created an index of just these stocks (in red).
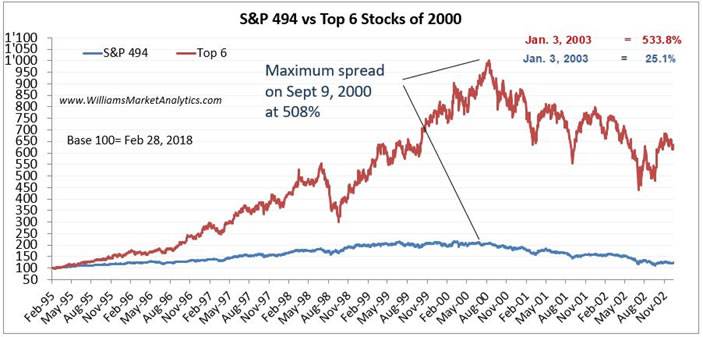
Once again, we observe a massive divergence between the top 6 index and the S&P 494. The performance differential was driven essentially by Cisco, Intel, and Microsoft. At the peak, this six-stock index was up almost 900%. By comparison, the S&P 494 peaked at 116%. As shown in the chart, the cumulative spread in favor of the top 6 stocks topped out at +508%.
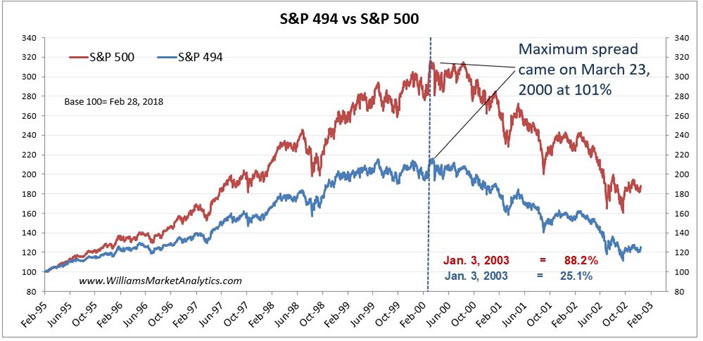
Next, we compare the S&P 500 to the S&P 494 back during the run-up to the 2000 highs. Curiously, the maximum cumulative performance differential came in March 2000. March 2000 also marked the index highs during the Tech Bubble. Based on the market in 2000, narrow leadership and index concentration indeed proved to be fatal for markets.
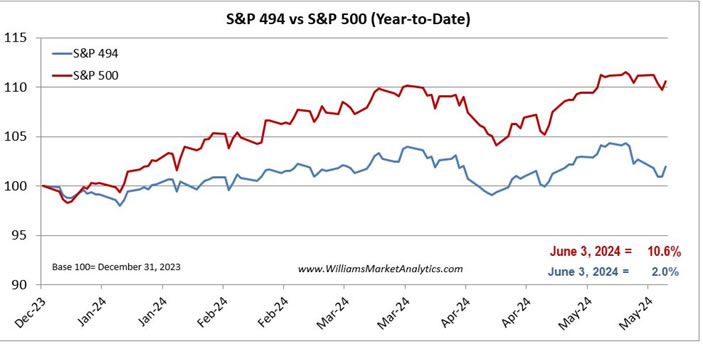
The final two charts zoom in on the relative performance year-to-date. The first chart shows that the Super 6 index is up a mind-boggling +45.4%, as of May 31, while the rest of the S&P 500 is up only +2.0%.
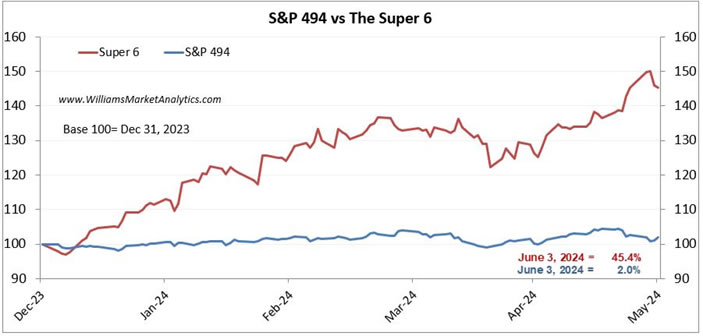
The S&P 500 is up +10.6% year-to-date as of May 31, again showing that the Super 6 account for about 80% of the S&P 500 performance in 2024.
Conclusion
Most investors recognize that we are experiencing extraordinary markets. The Super 6 stocks today are being driven higher by the AI narrative. Much as Cisco, Intel, and Microsoft saw their stock prices skyrocket on enthusiasm over the internet in the run-up to March 2000. We are not predicting that today’s AI bubble (our working assumption) will play out at the Internet bubble, with a three-year bear market. Our point is just to show some similarities and note the elevated risk that today’s narrow market leadership may pose.
To answer our research questions, first we obverse even greater concentration in the top six S&P 500 stocks today (29.7%) compared to the peak of the Tech bubble (19.4%). By comparison, in 2007 (a market top year) the top six S&P 500 stocks were Exxon, General Electric, Microsoft, Citigroup, Bank of America, and Procter & Gamble, and accounted for only 11.7% of the index. One indication that we might be in a bubble today is precisely the high degree of market concentration. Second, in both bubble periods, these extreme market concentrations resulted in large performance differentials between the top six stocks and the S&P 494. The 5-year cumulative gap between the S&P 494 and the top six index stocks was much larger in 2000 (+508%) than we see today (+408%). However, we can neither say that we’re at the top already or that there is a lot further higher to go. Finally, although we just looked at one prior bubble period, the narrow leadership in the market did end quite badly. And precisely starting at the time of peak leadership divergence. Our take-away is that very narrow market leadership tends to be a warning sign and occurs at the end of bull markets. Whether or not this time is different remains to be seen…
By Owen WIlliams
Owen Williams is professor of finance at the EM Lyon Business School. He holds a PhD in finance from the Grenoble Ecole de Management and is a CFA charterholder. His research interests include asset pricing, currency markets, and portfolio theory.
© 2024 Copyright Owen WIlliams - All Rights Reserved
Disclaimer: The above is a matter of opinion provided for general information purposes only and is not intended as investment advice. Information and analysis above are derived from sources and utilising methods believed to be reliable, but we cannot accept responsibility for any losses you may incur as a result of this analysis. Individuals should consult with their personal financial advisors.
© 2005-2022 http://www.MarketOracle.co.uk - The Market Oracle is a FREE Daily Financial Markets Analysis & Forecasting online publication.