Stock Market Trend Pattern and Bond Market Opportunity
Stock-Markets / Stock Market 2023 Sep 12, 2023 - 03:16 PM GMTBy: Nadeem_Walayat
Inflation Bond Fire of the Vanities Breeds Opportunity
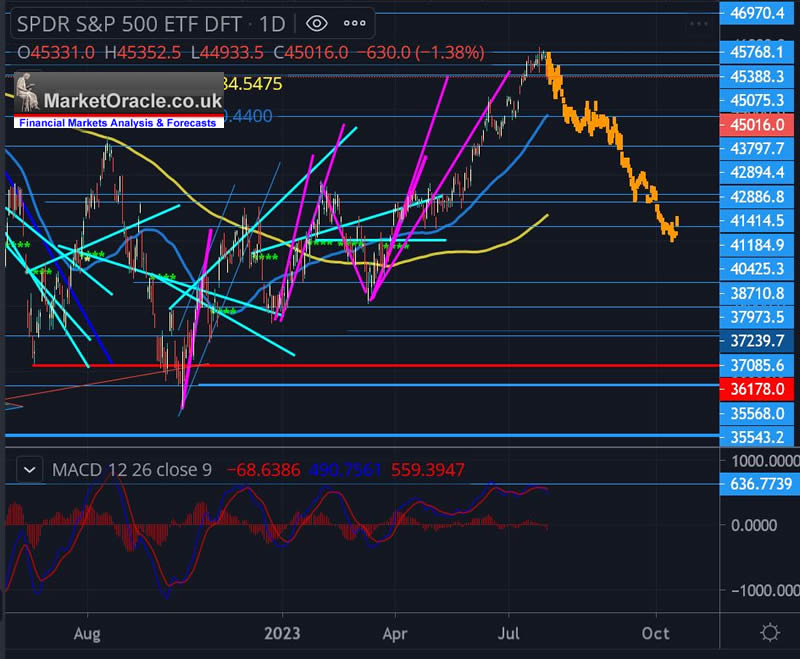
Fitch downgrades US Debt to AA+ prompts MSM clown narrative for triggering a rise in yields and falling stocks, there is ALWAYS a reason for why market moves, usually the same reason is used for either outcome up or down! The US debt downgrade that is the focus of MSM is a nothing burger as both rising yields and falling stocks were expected long before Fitch pressed the downgrade button as the stock market had transitioned form the topping phase off of the 4600 high set a few days ago (27th July) into a downtrend proper during August that is set to run into a window of late September to Mid October 2023 targeting a decline of at least 10%, so into and S&P range of 4180 to 4100 with many if not most target AI tech stocks set to see a decline typically by 20% off their highs, some more than others, and in fact many were already well into their downtrends coming into August such as AMD which topped at $132.5, which is why I often refer to the S&P as a red herring and caution against basing ones decisions off of the S&P, for instance there was no point waiting for S&P 4600 to trim AMD which FOMO 'd to $132.5 well over a month ago!
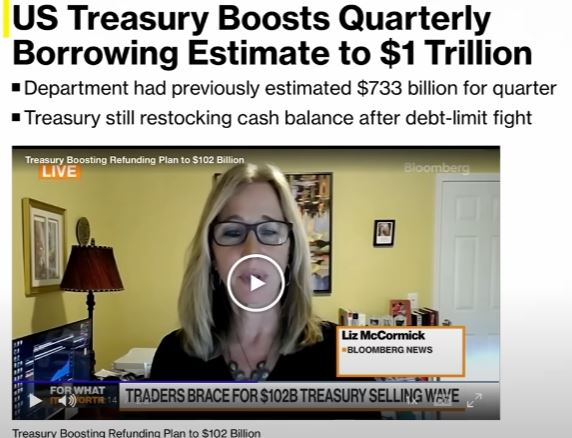
So all this fuss over a debt downgrade by an inept ratings agency (remember 2008) is pointless, don't these fools understand that US debt is denominated in US dollars? Thus US CANNOT DEFAULT ON IT's DEBTS because it can just KEEP PRINTING MONEY! Furthermore less than 25% of US debt is held by foreigners, leaving a large chunk of the rest parked on the Fed's balance sheet (near 1/3rd). And once again the stock market was primed for a drop right at the time of the downgrade as were treasury yields heading to new highs due to the deluge of new bonds being issued ($1 trillion this quarter).
Stock Market Analysis and Trend Forecast Oct 2022 to Dec 2023
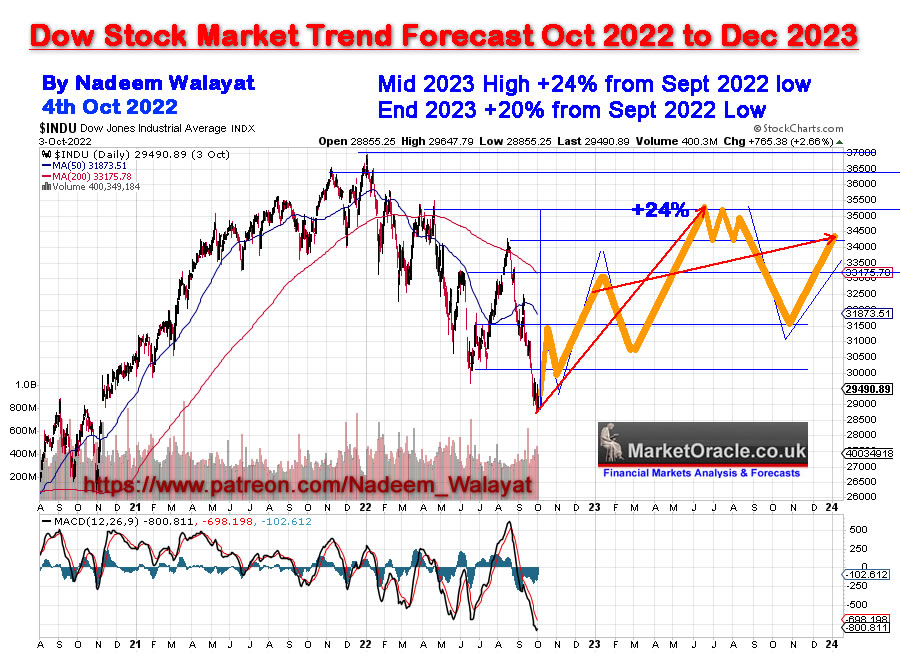
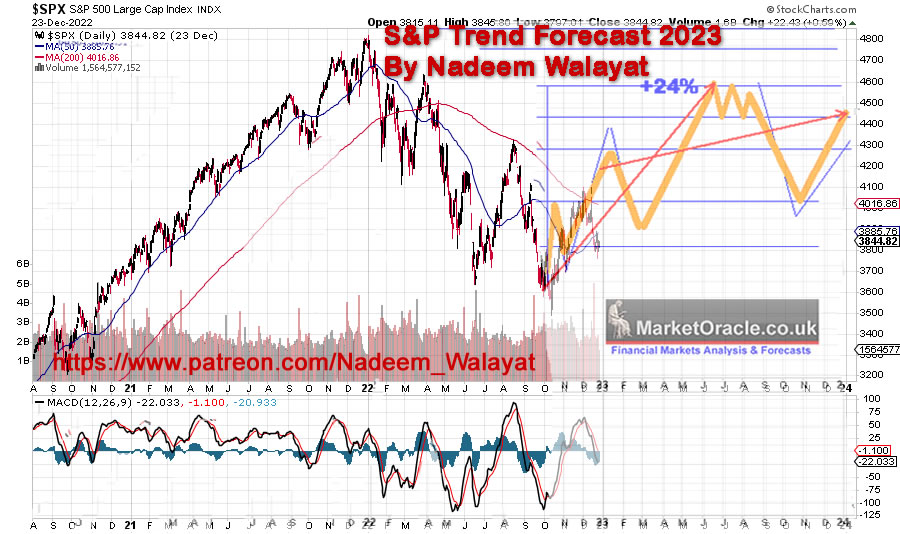
S&P targets a trend to 4600 by Mid Summer 2023.

The S&P began it's downtrend at the start of August so it's a case of 4600 mission accomplished with my best guess of how things could play out over the next couple of months which is pretty much inline with my road map of 10 months ago, so far little deviation against trend expectations ->
Just as the bears turned bullish which includes Mike 'the Bear' Wilson' in his last Monday update who apparently sees a 10% upside from 4600 after having MISSED 32% off the 3480 low!
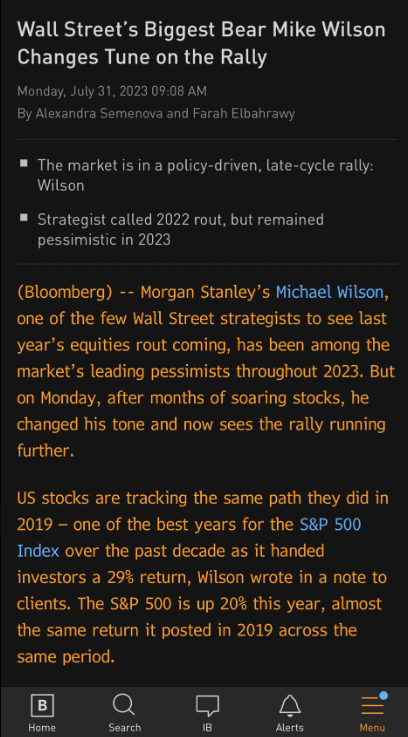
Bears Who despite having been wrong since the birth of this bull market in October 2022 are now apparently convinced stocks are entering a blow off top phase! I kid you not! The same clowns who have been bearish for the duration of this bull market are now BULLISH at the top! Against which the road map of 10 months ago states that we should now be entering into a correction that will see S&P about 10% lower and tech stocks typically twice that.
This article is excerpted from my extensive analysis Inflation Bond Fire of the Vanities Breeds Opportunity that was first made available to Patrons who support my work. So for immediate first access to ALL of my analysis and trend forecasts then do consider becoming a Patron by supporting my work for just $5 per month, lock it in now at $5 as this will soon rise to $7 per month for new sign-ups. https://www.patreon.com/Nadeem_Walayat.
Also gain access to my most recent analysis -
And gain access to my exclusive to patron's only content such as the How to Really Get Rich series/
Change the Way You THINK! How to Really Get RICH Guide 2023
Here's what you get access to for just $5 per month -
※ Patrons Get FIRST access to all of my In-depth analysis and high probability Trend Forecasts, usually 2 full months before the rest of the world. Notified by Patreon by email as well as posted on this page and I will also send a short message in case the extensive email does not make it to your inbox.
※Access to my carefully constructed and maintained AI Tech Stocks Portfolio that is updated on an ongoing basis, that includes on going commentary and a comprehensive spreadsheet that features unique innovations such as the remarkably useful EGF's.
※A concise to the point Investing Guide that explains my key strategies and rules
※ Regular content on How to Trade & Invest incorporated into most articles so as to keep patrons eyes on the big picture and net get too sucked into the noise of price swings.
※ Access to my comprehensive How to Really Get Rich series of articles, clear concise steps that I will seek to update annually and may also eventually form a Patrons only ebook.
※ Access to conclusions from my ongoing market studies from a total of over 200 conducted studies over the decades. updated whenever the market poses a question to be answered. Also enjoy the fruits of R&D into machine learning such as the CI18 Crash indicator that correctly called both the pandemic crash (Feb 2020) and the 2022 bear market (Dec 2021) well before the fact.
※Join our community where I reply to comments and engage with patrons in discussions.
※ I will also keep my Patrons informed of what I am currently working on each month.
※ Influence over my analysis schedule.
My objective is to provide on average 2 pieces of in-depth analysis per month and regular interim pieces of analysis as market briefs. So over a 12 month period expect to receive at least 24 pieces of in-depth analysis. Though my focus is on providing quality over quantity as you can see from the extent and depth of my analysis which I deem necessary so as to arrive at that which is the most probable market outcome.
So for immediate access to all my analysis and tremd forecasts do consider becoming a Patron by supporting my work for just $5 per month. https://www.patreon.com/Nadeem_Walayat lock it in before it rises to $7 per month for new signup's.
China Fakes
Is this bear in a chinese zoo real or fake, human in a costume?

Answer towards the end.
INFLATION
Firstly understand that inflation is by DESIGN, the last thing your masters want is for the slaves to stop working so one of the primary mechanisms used to keep the slaves working is inflation because it destroys the purchasing power of earnings and savings so that most folks are kept running on the work hamster wheel into their graves where their lifetime of savings have been eroded away by INFLATION, or stolen by the banking crime syndicate, financial con men and through a myriad of modern day scam artists, run a mile from fund managers! They are all scam artists! If you think UK and US inflation is high take a look at the poor souls in Turkey (where I will soon be taking a trip, Istanbul), 58% inflation against which the depositors are thrown scraps of a 15% TAXED interest! Yes that's right, you get TAXED on the interest that FAILS to keep pace with inflation! Same in the UK, fake inflation of 7.2%, savings rates typically of 4.5% to 5.5% and the lemmings appear on broadcast news happy that they are in receipt of a sub inflation pittance, this after TEN YEARS of STEALTH theft of the purchasing power of their savings! At least the risky stock market gives ordinary folks a good chance to avoid the stealth theft, money in the bank is guaranteed to be systematically STOLEN! Yes we can play the fixed rate game which can temporarily work, but money in the bank in the UK over 10 years will lose between 1/5th and 1/3rd of it's value!
The narrative right now is that inflation is falling and thus so should interest rates follow inflation lower. And yes US CPLIE inflation has fallen, it's now just 3%! Fed's Job done, clear blue sky's ahead, just 1 more rate hike and we are all done and dusted.
Wait a minute, if the war against inflation has already been won by the Fed Transitory brigade then why another rate hike?
Politicians and MSM economists fall into one of two camps -
1. They peddle propaganda, are vested interests in a narrative.
2. They are econofools who don't even understand about that which they write reams and reams of gobbledygook.
Repeatedly they mis report falling inflation as falling prices!
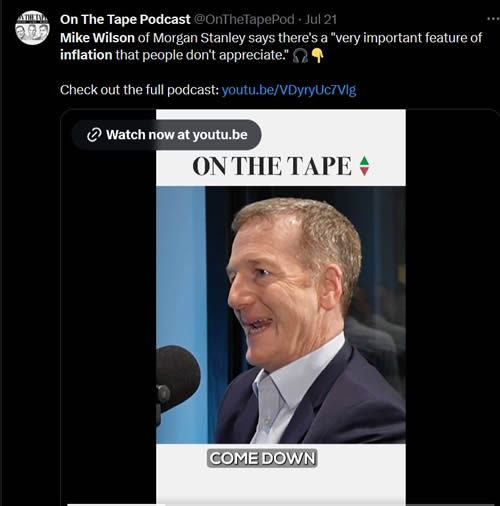
Don't be live me, here listen to Morgan Stanley's Mike Wilson where he likens falling inflation to prices coming down.
"Inflation is coming down.... there is a very important feature about inflation that people don't appreciate, when prices come down it hits your revenue line."
https://twitter.com/OnTheTapePod/status/1682514238579810305?s=20
No prices are not coming down! Falling INFLATION IS NOT PRICES COMING DOWN!
If Inflation was a stock I would NEVER SELL! Falling Prices indeed! And this is on the CPLIE measure which under reports REAL Inflation by X2 to X3! For instance UK CPI LIE has now 'fallen' to 7.9%! REAL Inflation is more like 18%! Whilst lemmings in the US are jumping for Joy at CPLIE of 3%, have these fools not heard of the base effect? That's when rampant inflation of a year ago LEAVES the annual indices which the econofools then run with to imply this that and the other...
Inflation reality even on the CPLIE measure is much better understood on the 10 year rate of change which is STILL RISING! This makes a mockery of what you are going to witness over the next 12 months were sticky CPI at best nudges a little lower, whilst at the same time the 10 year rate continues to climb higher! Which will reflect the REAL INFLATION pain that folks in the US will experience that the econofools will be completely blind to as it is not even on their radar! They DO NOT SEE IT! CPLIE lower, 10year CPILIE higher = MORE INFLATION PAIN just as I was warning a year ago would transpire is now coming to pass and which will have societal consequences, we already see it with the rampart shop thefts taking place across the United States prompting many stores to close down.
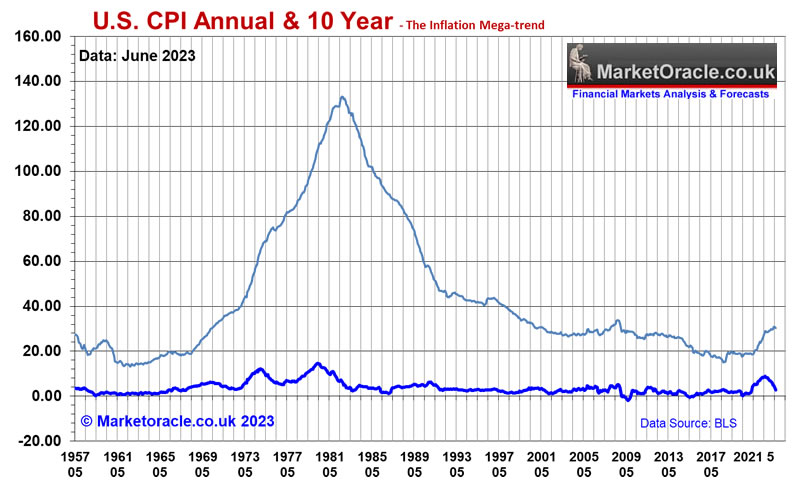
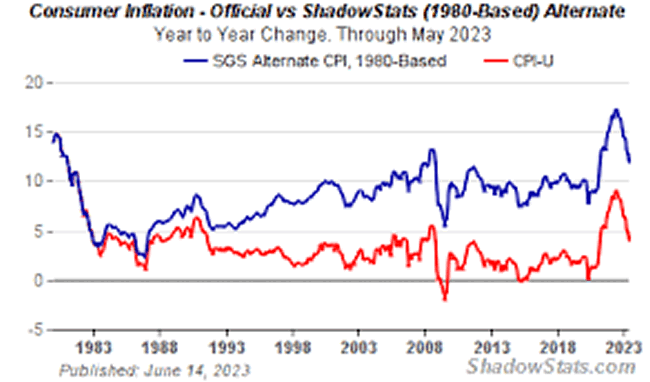
The Inflation reality is that the US has systematically manipulated the inflation rate lower over the decades to make it meaningless where according to shadowstats the real US Inflation rate is triple the official rate based on 1980's methodology which makes a mockery of all that which passes for economic analysis as the econofools don't even realise that the official inflation measure is FAKE! Real inflation as experienced by most in the US is nearer to 9% than 3%!
And the same is true for the UK where UK CPLIE is about HALF REAL inflation that ordinary folks experience as they go and do their weekly shops! Grocery prices in the UK have DOUB;ED over the past 3 years! That's more than TRIPLE the official rate of UK inflation!
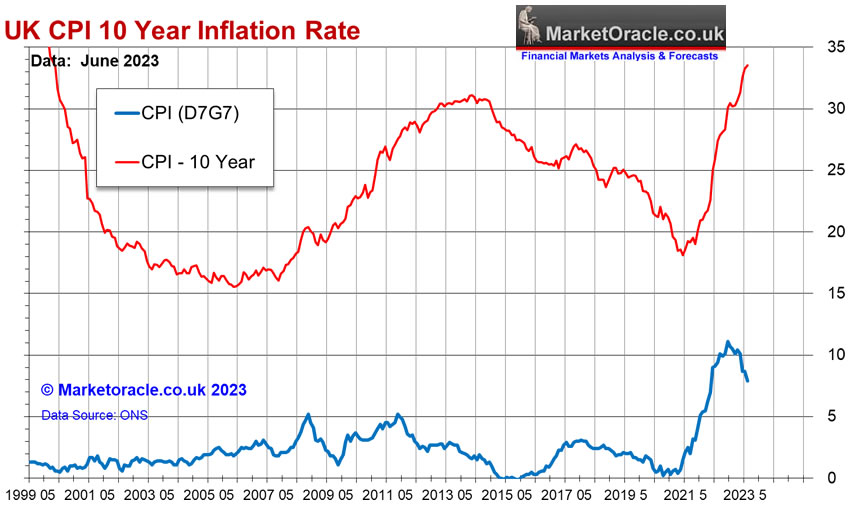
Whilst the annual rate of UK inflation will continue to come down, especially following release of October data in November that will see a large drop in CPI due to the base effect to something like 4.6% from the current 7.9%, with perhaps further falls for November and December to end the year near 4%. However all of this is a big con trick on the public because the 10 year inflation rate that illustrates the INFLATION PAIN ordinary folk experience will continue to climb ever higher! And thus a huge disconnect between what the econofools state about falling inflation which will be set against the reality of the RISING 10 year inflation rate. The people are NOT going to feel the drop in CPI LIE, instead for most the PAIN of rising prices will just keep getting worse!
The bottom line is that the inflation indices are FAKE! REAL inflation is at least TWICE CPLIE which means in the US it is 6%, and in the UK 16%! Now do you understand why interest rates are rising and why they are not going to come down any time soon! Why the Fed cannot cut short end interest rates until CPLIE falls to BELOW 2%, it's because CPI IS FAKE! They have fiddled with it to such an extent to have made it worthless on the annualised measure that virtually all focus on. Fools are basing their interest rate expectations on a broken FAKE measure of inflation!
Yield Curve Inversion
The yield curve is the Ten Year yield Minus 2 Year Yield - What it shows is when short money is more expensive (higher rates) then long money, why is that? Forward economic weakness thus lower forward rates? Yes that is a valid argument but I suspect that in large part is the WRONG conclusion, it is after all the consensus view, what the econofools regurgitate across MSM, long rates are lower because the market is discounting future interest rate cuts is WRONG!
Maybe if they weren't prone to following the herd they would realise that the government wants lower longer term interest rates so that it pays LESS interest on the debt it issues! That and market rates for loans tend to be more sensitive to the short end so if the government wants to reduce economic activity to curb inflation then the yield curve inverts by design and not as an act of god to warn of a recession. Understand this the bond markets are very heavily manipulated where the central banks stand ever present to intervene to unlimited extent to ensure the bond markets do exactly what they want them to do so that the government can continue printing debt whilst paying a low interest rate.
Yield Curve Inversion and Recessions
Apparently the yield curve inversion has a 100% hit rate, whenever a yield curve inverts it has always resulted in a recession.
Only problem is that it can take anywhere from 6 months to 3 years for the recession to materialise! Thus is another one of those nothing burgers that most analysts obsess over. For instance take the current inversion as of March 2022, those who swallowed the recession is coming mantra have been sat in money market accounts for the last 9 months whilst stocks such as META first doubled, then tripled and look set to quadruple, what kind of *****-A-Doodle-Doo indicator is the yield curve inversion? Which is why I don't tend to pay it much attention, given that it is pretty much useless in terms of investing.
The funny thing is that because a recession has NOT materialised the likes of Goldman Sachs are now proclaiming that this time is different! Which is actually more useful, i.e. expect the opposite of Goldman Sachs and you'll be right 9 times out of 10! Thus a recession is coming, not because of the inverted useless yield curve but because Goldman Sachs public propaganda tends to be false.
RECESSION ODDS
A recession is what's going to be needed to cool real inflation which the econofools will call deflation! There can be no deflation because CPLIE is FAKE! The real prices in an economy rarely fall, and then we have the GDP price deflator con which tends to be LOWER than CPLIE so that recessions can be statistically dodged! Economic activity is better measured by the EGF's on the Portfolio spreadsheet, when so many stocks are deeply in the red is warning of underlying recessionary forces at work and this from a basket of largely tech stocks, so limited in scope but still beats fake GDP! So as a rule subtract 1% to get a more accurate measure of GDP, which means today's annualised Q1 rate of 2% in reality is more like 1%. So when the US is reporting an annualised rate of less than 1% than that translates into economic contraction.
So on the official GDP measure it is highly probable that the US can dodge a recession i.e. 2 consecutive quarters of negative growth but if GDP slows to 0.5% that in reality will translate into contraction of 0.5%. What this means is that interest rates won't be coming down anytime soon no matter what CPLIE does as the Fed will point to positive (fake) GDP to maintain higher interest rates. Furthermore there is no big collapse to trigger a recession i.e. in 2000 it was the tech sector, 2008 the banks and housing market, 2020 was the shutdown, and today there is nothing on an economy wide scale that is actually collapsing to trigger a deep recession.
US Presidential Election Cycle and Recessions
As my analysis of Jan 2023 pointed out (Stock Market Gasping to Reach 4000 Ahead of Earnings Season, Dow New All Time High 2023?)
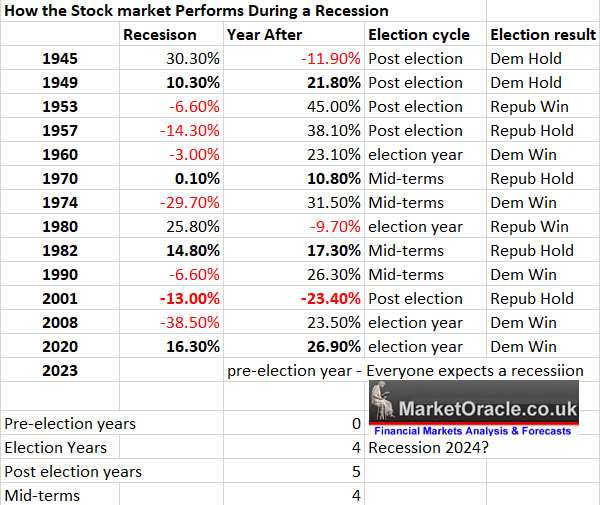
That there has been no recession in a pre-election year since 1945, instead the recession was most probably likely to take place during 2024 and thus warned to expect upwards earnings surprises for Q1 and Q2 just as have transpired and propelling the S&P to the expected level of 4600. So all of that noise we have heard for the past year across MSM warning of a recession for 2023 and thus scared many investors out of the market until recently proved to be a HUGE nothing burger! A recession was never on the cards for 2023, it's 2024 and definitely 2025 where the real recession risks are. Instead at S&P 4600 recession fears have been replaced with soft landings, or a rolling sector recession, or goldilocks, a recession is coming folks during 2024.
Yes, what the US suffers will be mild compared to what the rest of the world will experience. The UK is definitely going to take a hit with economic pain as the Bank of England is forced to raise and keep rates higher for longer than they should, but that's what happens when one loses control of inflation!
In terms of where CPLIE is heading, well it looks like a tale of two cities, according to the base effect US inflation should be heading higher, where today's 3% could end 2024 on 4% (10th August could see a surprise rise). Whilst the UK is still pending it's base effect drop that is due on release of Octobers data in November, so UK inflation is set to trend lower whilst US inflation higher which suggests upwards pressure on US yields whilst UK yields will play follow the Fed leader so even if inflation falls they will track the US yields higher at least on the short-end. Thus we should see plenty of opps to accumulate US and UK bonds over the coming months, though remember bond prices move ahead of the news so rather than play a wait and see game it's a case acting ahead of the news whilst allowing for fake indices, thus materialising economic weakness in the UK will put downwards pressure on the long-end.
Inflation is by design, run away is a function of incompetence in the management of money printing, they got carried away and printed too much money and now are forced to reign in inflation. So yes there will be a 'recession' so that they are able to press the reset button on the annual change in consumer prices,
last Thursday saw the Bank of England lemmings raise rates to 5,25%, this will be painful because the UK is more sensitive to short rates than the US given fewer have longer fixes in the UK on mortgages etc. in terms of house prices it will be balancing act between economic weakness set against underlying real inflation, whatever house prices weakness occurs it will prove temporary given that the Government will not be able to resist pressing the Print Money button which is what politicians always do that will ignite asset price inflation.
ANNUAL DEFICITS ARE NOT IMPROVING
The pandemic a once in a 100 year event sparked rampant deficit spending to bailout the economy, that was 2020, whilst 2021 was nearly as bad! And 2022 did show an improvement by reverting back to pre-pandemic deficit era extremes. However the 2023 deficit is once more ramping up and running at twice the pre-pandemic extreme rate.
See that huge pandemic spike during 2020, well get ready for it to be surpassed over the coming years! Soon the great Financial Crisis bailout will look like an everyday drop in the ocean!
The US debt mountain has now passed £27 trillion, 100% of GDP after adding nearly $4 trillion for 2020-21! Which makes a mockery of the crap that flows out of politicians mouths that they will balance the budget, pay down the debt which NEVER HAPPENS!
Once the government increases spending it is near impossible to reverse that spending even if it were temporary such as in response to the pandemic which saw the US government DOUBLE expenditure, now 3 years on we see that expenditure has NOT reverted to trend, but sits over $1 trillion higher than where it should be that looks set to accelerate over the coming year which will translate into MORE DEBT.

What are the consequences of the US government printing and spending $4 trillion dollars during 2020 and then continuing to spend between $1 to $2 trillion a year above trend since? HIGH REAL INFLATION! So what should you do? Invest in assets such as real estate and good stocks that cannot be easily printed. Thus in these graphs you have your housing and stocks bull market smoking guns. All whilst the perma fools continue to bang the decades long drums for always imminent debt bubble bursting deflation. All whilst the money printing induced inflation mega-trend continues on it's exponential trajectory.
The rest of this extensive analysis Inflation Bond Fire of the Vanities Breeds Opportunity was first made available to Patrons who support my work. So for immediate first access to ALL of my analysis and trend forecasts then do consider becoming a Patron by supporting my work for just $5 per month, lock it in now at $5 as this will soon rise to $7 per month for new sign-ups. https://www.patreon.com/Nadeem_Walayat.
For Immediate first access to ahead of the curve analysis as my extensive analysis of the stock market illustrates (Stocks Bear Market Max PAIN - Trend Forecast Analysis to Dec 2023 - Part1), that continues on in the comments section of each posted article, all for just 5 bucks per month which is nothing, if you can't afford 5 bucks for month then what you doing reading this article, 5 bucks is nothing, if someone did what I am doing then I would gladly pay 5 bucks for it! Signup for 1 month for a taste of the depth of analysis that cannot be beat by those charging $100+ per month! I am too cheap! Hence the price for new signup's will soon rise to $7 per month so lock it in now, $5 per month is nothing for what you get access to so at least give it a try, read the comments, see the depth of analysis, you won't be sorry because i do do my best by my patrons, go the extra mile and then some.
S&P
Targeting 4600 Mid Summer 2023 Top, followed by correction into Mid October.
Also gain access to my exclusive to patron's only content such as How to Really Get Rich!
Change the Way You THINK! How to Really Get RICH Guide 2023
And my most recent article - Stock Market Ready to Tumble
Again for immediate access to all my work do consider becoming a Patron by supporting my work for just $5 per month. https://www.patreon.com/Nadeem_Walayat lock it in before it rises to $7 per month for new signup's.
And ensure you are subscribed to my ALWAYS FREE newsletter for my next in-depth analysis.
Your trimmed the FOMO to buy the Dip analyst.
By Nadeem Walayat
Copyright © 2005-2023 Marketoracle.co.uk (Market Oracle Ltd). All rights reserved.
Nadeem Walayat has over 30 years experience of trading derivatives, portfolio management and analysing the financial markets, including one of few who both anticipated and Beat the 1987 Crash. Nadeem's forward looking analysis focuses on UK inflation, economy, interest rates and housing market. He is the author of five ebook's in the The Inflation Mega-Trend and Stocks Stealth Bull Market series that can be downloaded for Free.
 Nadeem is the Editor of The Market Oracle, a FREE Daily Financial Markets Analysis & Forecasting online publication that presents in-depth analysis from over 1000 experienced analysts on a range of views of the probable direction of the financial markets, thus enabling our readers to arrive at an informed opinion on future market direction. http://www.marketoracle.co.uk
Disclaimer: The above is a matter of opinion provided for general information purposes only and is not intended as investment advice. Information and analysis above are derived from sources and utilising methods believed to be reliable, but we cannot accept responsibility for any trading losses you may incur as a result of this analysis. Individuals should consult with their personal financial advisors before engaging in any trading activities.
Nadeem Walayat Archive |
© 2005-2022 http://www.MarketOracle.co.uk - The Market Oracle is a FREE Daily Financial Markets Analysis & Forecasting online publication.


