


US dollar Index (DXY) Hanging Tough
Currencies / US Dollar Aug 14, 2023 - 07:36 AM GMTBy: Gary_Tanashian

NFTRH subscribers and I have been keeping well aware of the implications of a) USD following its daily chart downtrend, or b) painting the July plunge as a bear trap and going bullish again. We’ll leave the detailed implications aside in this post and simply note that the process is still evolving.
From this NFTRH+ video update (now public), that projected the up move on July 19:
USD can break through it [clear resistance at the time, now support] and test the SMA 50 and still remain in a downtrend.
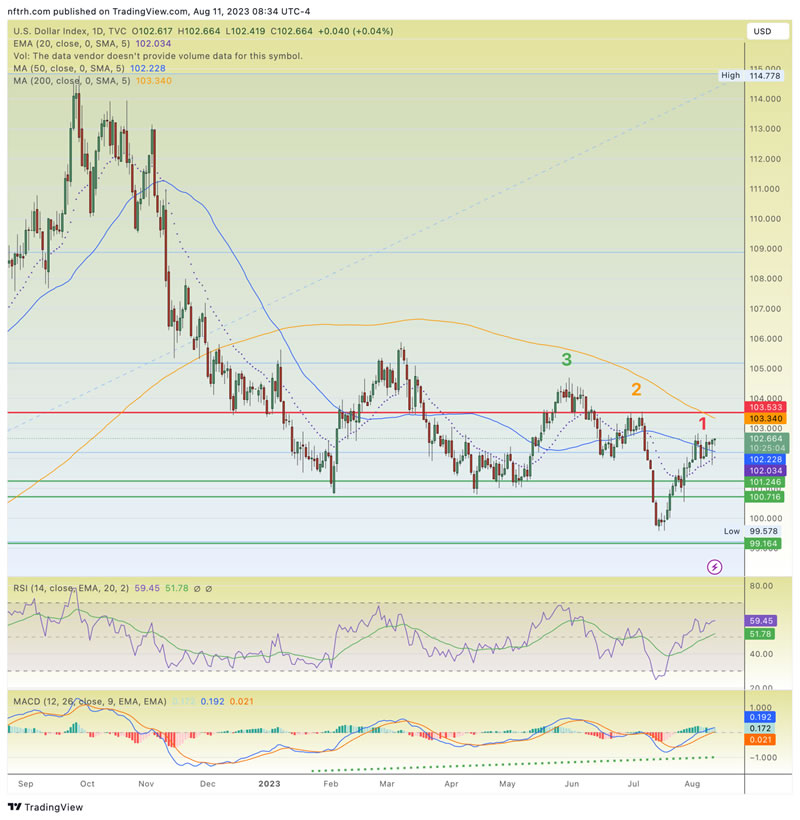
A downtrend it still is, to this day. But we have since assigned 1-2-3 levels as objectives/resistance:
- 1) 50 day moving average, which Uncle Buck currently sits atop.
- 2) Clear resistance and the downtrending SMA 200, which Uncle Buck is eyeballing now for an important test.
- 3) Likely a big time trap of USD bears and asset market liquidity issues if this is taken out and other indicators (hello Gold/Silver ratio) corroborate, which I expect they would.
But as yet the major daily chart trend is down and a test of the SMA 200 will be very important. Despite the weakening inflation signals in the wider macro and slowly decelerating economy, which would indicate a weakening Fed from its hawkish stance, the US dollar is improbably still buoyant. Except that it was not improbable. It was right there in the July 19 update linked above.
Let there be no ghost stories about manipulation, please. “They” are not controlling the dollar, or stocks or gold for that matter, to any large degree. The market is doing what it will do.
While our operating plan has been for a resumed bear phase within USD’s long-term bull market, there is a perfectly viable scenario where USD could break the daily chart bear trend. That scenario is an asset market liquidity crisis that would, despite the “dedollarization” touts, drive the herds to the perceived safety and liquidity of the US dollar. A monetarily Utopian concept like the BRICS forming a hard asset backed currency block may happen one day, but it will very likely not apply in the next liquidity crisis.
Moving on to the weekly chart, we have a nice view of a bull market correction that did not quite touch the 62% Fibonacci retrace level. That may or may not be unfinished business and indeed, if the daily chart above does hold its bear trend and assert itself on the longer-term view we have targets for USD that are significantly lower.
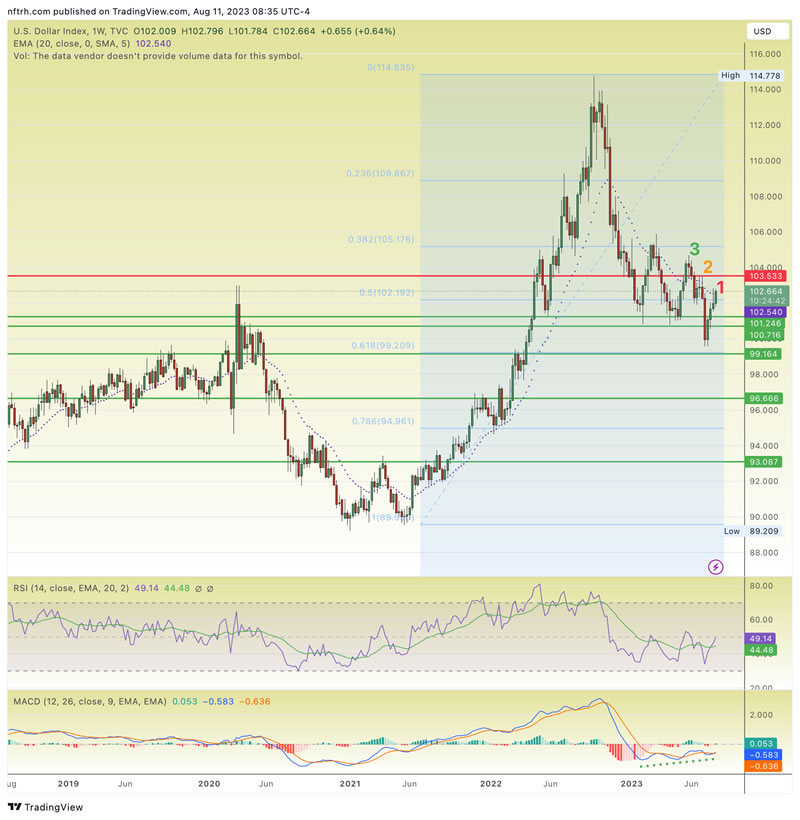
That would be party time! Wayne and Garth would greedily buy assets, especially those most ‘anti’ to the US dollar index.
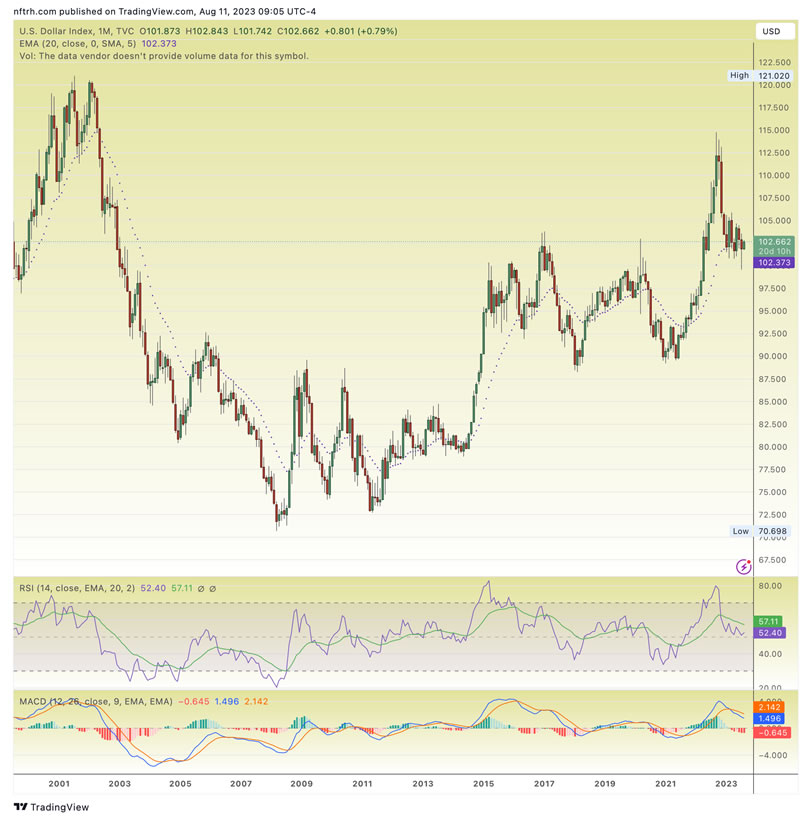
But as the big picture monthly chart shows, the US dollar is not even in danger of losing its big bull market from 2008 unless it takes out the 90 level. And you can sure as shootin’ bet that the next asset market liquidity crisis will come well before that level is approached.
For “best of breed” top down analysis of all major markets, subscribe to NFTRH Premium, which includes an in-depth weekly market report, detailed interim market updates and NFTRH+ dynamic updates and chart/trade setup ideas. You can also keep up to date with actionable public content at NFTRH.com by using the email form on the right sidebar. Follow via Twitter ;@NFTRHgt.
By Gary Tanashian
© 2023 Copyright Gary Tanashian - All Rights Reserved
Disclaimer: The above is a matter of opinion provided for general information purposes only and is not intended as investment advice. Information and analysis above are derived from sources and utilising methods believed to be reliable, but we cannot accept responsibility for any losses you may incur as a result of this analysis. Individuals should consult with their personal financial advisors.
Gary Tanashian Archive |
© 2005-2022 http://www.MarketOracle.co.uk - The Market Oracle is a FREE Daily Financial Markets Analysis & Forecasting online publication.