


Using Forex Trading Charts for Trend Analysis & Predictive Trading
Currencies / Forex Trading Mar 06, 2023 - 07:45 PM GMTBy: Boris_Dzhingarov

The foreign exchange, or forex, market is the largest financial market in the world. Traders in the forex market use various tools to analyse trends and make informed trading decisions. One of the most valuable tools for forex traders is the trading chart, which enables traders to track market movements and identify potential trading opportunities.
This article will explore how forex trading charts can be used for trend analysis and predictive trading. If you’re looking for a way to level up your forex trading game, why not use the tradingview platform?
Types of forex trading charts
There are three main types of forex trading charts: line charts, bar charts, and candlestick charts.
Line charts
As one of the simplest chart types, line charts are easy to read and only display the closing price of different pairs over a specified period. They are great for identifying long-term trends but provide less detail than other chart types.
Bar charts
Bar charts display a range of data, including the opening price, closing price, high price, and low price of currency pairs over a given period. Bar charts help identify trends, but they can be challenging to read for novice traders.
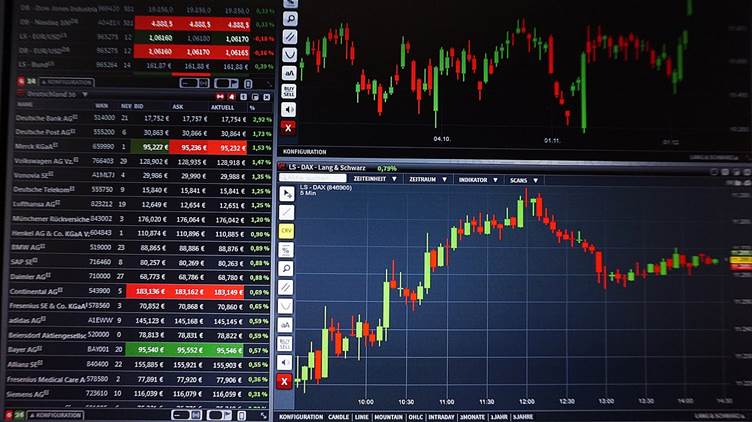
Candlestick charts
As one of the more popular chart types for forex traders, candlestick charts provide the same information as bar charts but in a more visually appealing way. Candlestick charts use coloured bars to show the opening and closing prices of currency pairs, and lines to show the high and low prices. Candlestick charts are great for identifying trends and potential trading opportunities and are the most commonly used chart type in the forex market.
Using forex trading charts for trend analysis
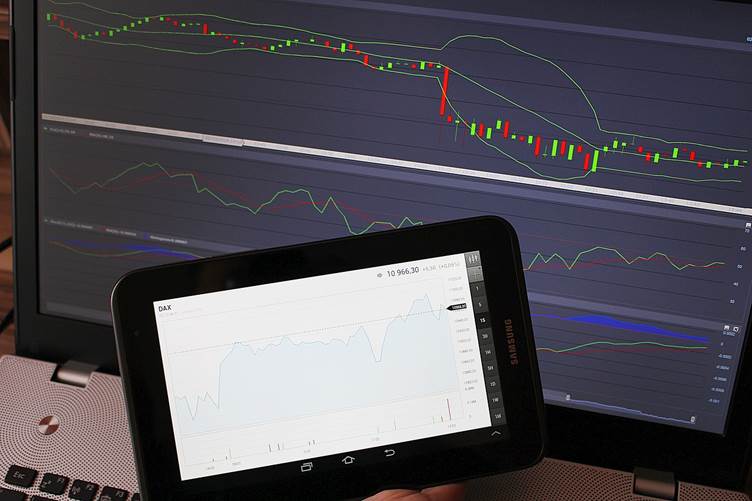
One of the primary uses of forex trading charts is for trend analysis. Trends can be defined as the general direction in which a market is moving over a given period. Forex traders use charts to identify trends and make informed trading decisions.
To identify trends using a trading chart, traders must choose a timeframe. The time frame will determine the length of time the chart will display. Typical time frames include 1 minute, 5 minutes, 15 minutes, 1 hour, 4 hours, daily, weekly, and monthly.
Once the timeframe has been chosen, traders can begin to analyse the chart. If the chart displays an upward trend, with prices generally increasing over time, the market is said to be bullish. If the chart shows a downward trend, with prices usually decreasing over time, the market is said to be bearish.
Traders can also use forex trading charts to identify potential trend reversals. For example, if the chart displays a long-term downward trend, but prices begin to increase over a shorter period, this could indicate a potential trend reversal. Traders can use this information to make informed trading decisions.
Using forex trading charts for predictive trading
In addition to trend analysis, forex trading charts can be used for predictive trading. Predictive trading involves using technical analysis to identify potential trading opportunities before they occur.
To use forex trading charts for predictive trading, traders must use technical indicators. Technical indicators are calculations based on currency pairs' price and/or volume over a set period. Traders can use various technical indicators, including moving averages, stochastic oscillators, and relative strength indicators.
Traders can use technical indicators to identify potential trading opportunities. For example, if a technical indicator shows that a currency pair is oversold, with prices lower than the indicator predicts, this could indicate a potential buying opportunity. On the flip side, if a technical indicator shows that a currency pair is overbought, with higher prices than the indicator predicts, this could indicate a potential selling opportunity.
Conclusion
Forex trading charts are an essential tool for any forex trader, and they provide valuable information on market trends and potential trading opportunities. By using trading charts for trend analysis and predictive trading, traders can make informed decisions and maximise their profits in the forex market.
It is important to note that technical analysis can provide valuable insights into market trends, but it does not guarantee future performance.
It is essential to continually monitor and analyse forex trading charts, as they are a powerful tool for trend analysis and predictive trading. Traders can use various chart types and technical indicators to make informed trading decisions. However, market conditions can change rapidly, and traders must be prepared to adapt their strategies accordingly.
By Boris Dzhingarov
© 2023 Copyright Boris Dzhingarov - All Rights Reserved
Disclaimer: The above is a matter of opinion provided for general information purposes only and is not intended as investment advice. Information and analysis above are derived from sources and utilising methods believed to be reliable, but we cannot accept responsibility for any losses you may incur as a result of this analysis. Individuals should consult with their personal financial advisors.
© 2005-2022 http://www.MarketOracle.co.uk - The Market Oracle is a FREE Daily Financial Markets Analysis & Forecasting online publication.