


How Stocks Bear Markets DIE! Technical Trend Analysis Forecast 2023
Stock-Markets / Stock Market 2023 Dec 26, 2022 - 04:10 PM GMTBy: Nadeem_Walayat

Dear Reader
Dow Short-term Trend Analysis
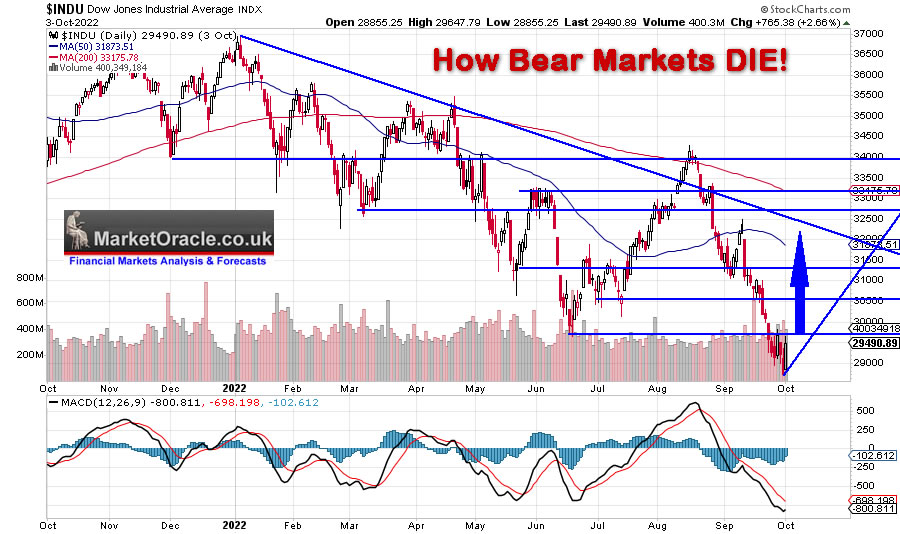
The Dow is bouncing off a new bear market low of 28,700 having already broken above the preceding low of 29.7k that targets resistance at 31k. However given the degree of momentum behind this rally the Dow could easily continue climbing to target 32k which would represent a sizeable 12% advance in what I would consider as being a sub-swing i.e. not the whole move which implies that this rally that apparently is being dismissed by most as bear market rally could eventually retrace the whole disown move from the 34k high. But for now the Dow 1st targets 31k and then 32k before it is likely to correct towards 30.5k before RESUMING it's bull run.
(Charts courtesy of stockcharts.com)
This article is part 5 of 6 excerpts form my extensive analysis that concludes in detailed stock market trend forecast into the end of 2023 Stocks Bear Market Max PAIN - Trend Forecast Analysis to Dec 2023 which was first made available to patrons who support my work.So for immediate first access to ALL of my analysis and trend forecasts then do consider becoming a Patron by supporting my work for just $4 per month, which is soon set to rise to $5 per month for new signup's so lock in now at $4 per month. https://www.patreon.com/Nadeem_Walayat.
PART ONE: Stock Market Trend Forecast October 2022 to December 2023
Keep Calm and Carry on Buying Quantum AI Tech Stocks
Stock Market AI mega-trend Big Picture
Stock Market 2022 Trend Current Expectations Review
Feeding the Beast
Quantum AI Tech Stocks Portfolio
STOCK MARKET DISCOUNTING EVENTS BIG PICTURE
US Economy and Stock Market Addicted to Deficit Spending
The Inflation Mega-trend
US Economy Has Been in an Economic Depression Since 2008
WHY PEAK INFLATION RED HERRING
US interest Rates and Inflation
Inflation and Interest rates Implications for the Stock Market
TIPS BONDS INFLATION PROTECTION
FED Balance Sheet
SMASHED Bond Market Brewing Opportunity
Stocks and Inverted Yield Curve
US Dollar Big Picture
US Dollar Strength Implications for Global Economies
Financial Crisis 2.0 and Interest Rates
UK Economy and British Pound Trend Forecast
RECESSIONS 2023
The Stock Market Recession Pattern
PART TWO: Stock Market Trend Forecast October 2022 to December 2023
Will there be an Early Fed Pivot?
Why Most Stocks May Go Nowhere for the Next 10 Years!
Valuation Reset and Future EPS
Margin Debt
Answering the Question - Has the Stocks Bear Market Bottomed?
Stock Market Breadth
Stock Market Investor Sentiment
Dow Short-term Trend Analysis
Dow Long-term Trend Analysis
ELLIOTT WAVES
Dow Annual Percent Change
Stock Market Volatility (VIX)
Stocks and 10 Year Bond Yields
SEASONAL ANALYSIS
Correlating Seasonal Swings
Major Market lows by Calendar Month
US Presidential Cycle
Best Time of Year to Invest in Stocks
Formulating a Stock Market Trend Forecast
Dow Stock Market Trend Forecast September 2022 to December 2023
Most recent analysis includes -
- Santa Battles Grinch to Deliver Stock Market Last Gasp Rally into the New Year
- Santa Sledge on the Launch Pad for Stock Market Post CPI To the Moon Rally
- Stocks Analysis Bonanza - GOOG, QCOM, ASML, TCHEY, BABA, BIDU, TSLA, WDC, RBLX, MGNI, COIN, BITCOIN CAPITULATION!
- How High Could the Impossible Stocks Bull Market Fly Into Christmas 2022
- Stock Market Cool as a Cucumber Despite Earnings and Fed Noise
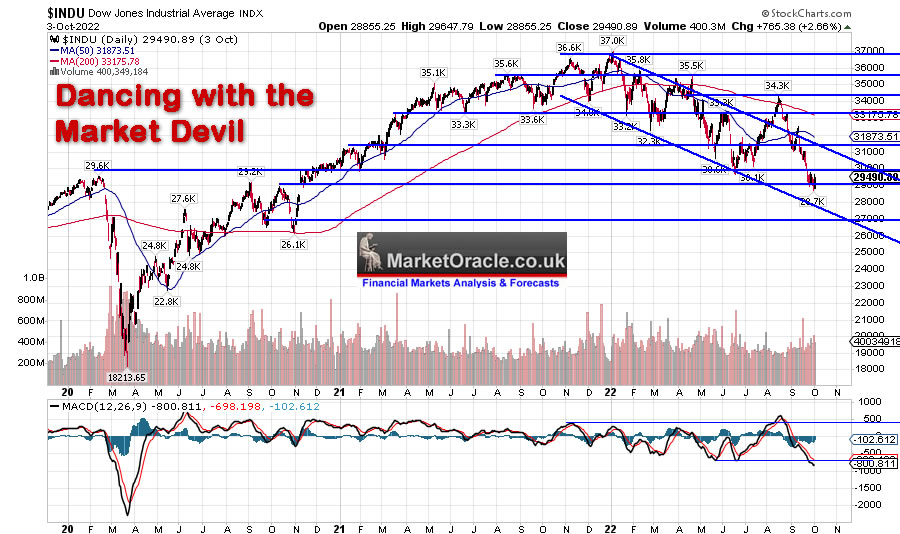
Dow Long-term Trend Analysis
The Dow fulfilled my primary target for this bear market by retracing all the way to the 29,600 pre pandemic high. Whilst it would have been nice if the 29,600 low had held, however it was never probable as where the markets are concerned things never tend to turn out to be so simple and hence the Dow confused all by setting a new bear market low at 28,700 and then abruptly doing a u-turn, something that I was prepared for, for how things could play out i.e. at least 1 spike below the June low just to get moist convinced of much lower prices, akin to dancing with the market devil, trying to anticipate it's nifty footwork.
TREND CHANNELS - The recent decline whilst to a new bear market low failed to make it all the way to the support channel, this could indicate that the SELL off off 34k is NOT over. However more probable is that this indicates relative strength that marks the demise of the bear market given that the 34k high breached the upper channel and thus two relative strength indicators against the preceding bear market into the June low.
TREND ANALYSIS - The Dow has made a lower at 28.7k, which means it is not going to be easy for the Dow to break above the 34.3k higher high, so any trend back towards 34.3k will fail to break higher and thus resolve in a significant correction back towards at least 31,500 and probably lower and could even set the stage for a further NEW bear market low where we have a contender for at 26.1k after failure of 29.6k to hold. So trend wise the new low still has the bears in control of the trend and it is upto the market to prove that it can make a higher low.
RESISTANCE - Resistance is along a string of lows at 30.1lk, 30.6k, and 32.3k.
SUPPORT - Apart from the new bear market low of 28.7k, the next support would be 26.1k.
MACD - MACD is at the most over sold state that it has been for the duration of this bear market, and thus the current surge higher should not come as much surprise, even though it has to most! The rally has scope to run for several weeks. probably months which chimes well for where we are i.e. a setup for a 3 month bull run into the end of the year.
ELLIOTT WAVES
Despite being skeptical of Elliott wave theory and not abiding by any of it's tenants, i.e. I number the counts as I see them regardless of following the 'rules. Nevertheless. Elliott wave proved a useful tool during 2021 in the count down to the end of the Stocks bull market and the start of this bear market as the charts illustrate, that there are times when EW BS actually works!
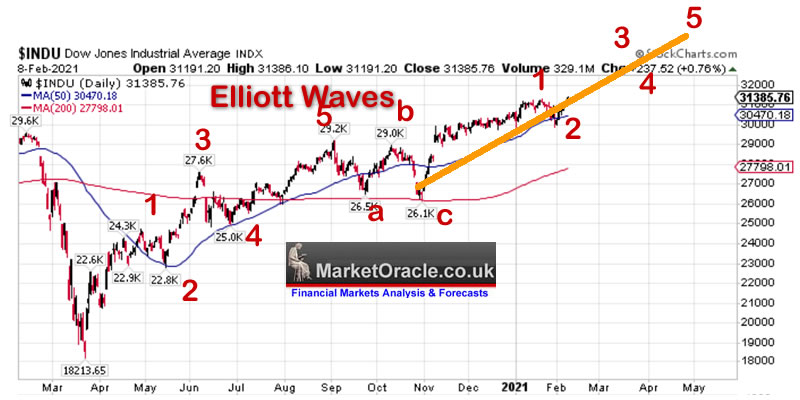
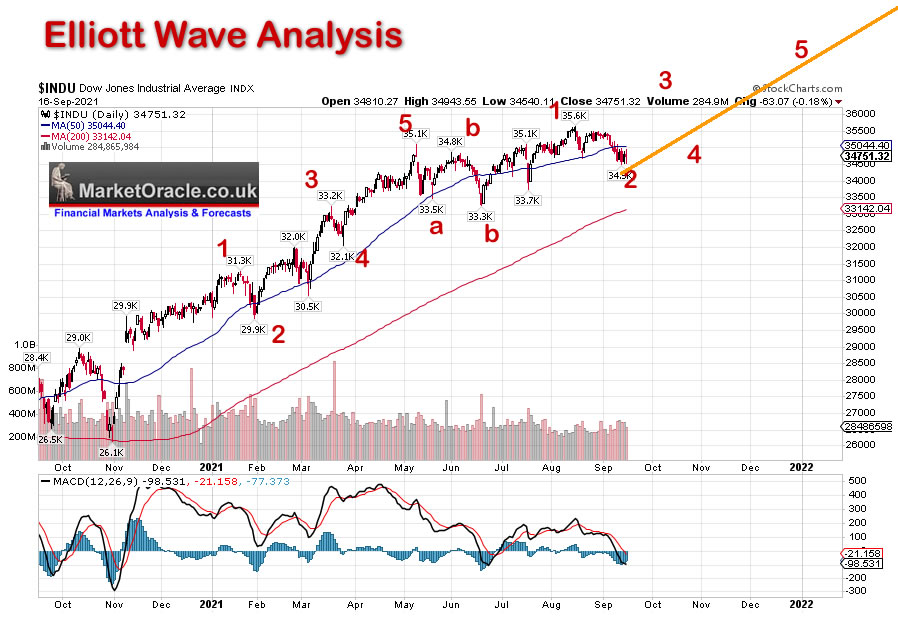
So what does my 'skeptical' interpretation of elliott wave theory suggest for the remainder of 2022? The June bottom being a 5 wave decline to mark the A wave down, that if true should result in a powerful B wave rally that far exceeds the preceding bear market upswings, so far so good.
The FUTURE - What comes next should be a C wave decline that could either comprise 3 waves or 5 waves, since wave A comprised 5 waves then that suggests C wave will likely comprise 3 waves! Therefore EWT suggests a volatile trend to a new Dow low probably by late October targeting approx 28,600 which then should give birth to the NEW stocks BULL MARKET!.
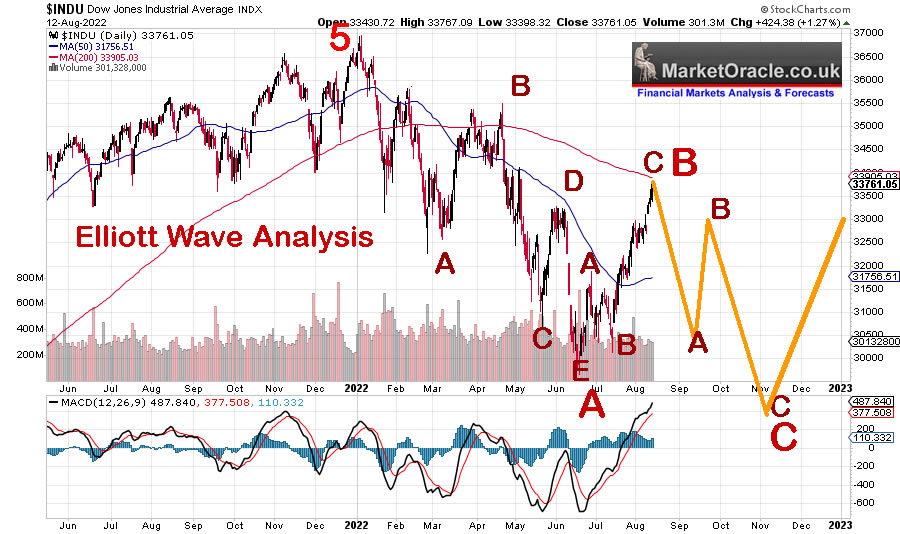
The alternative count is...... there is no alternative count, that's for losers who hedge their bets.
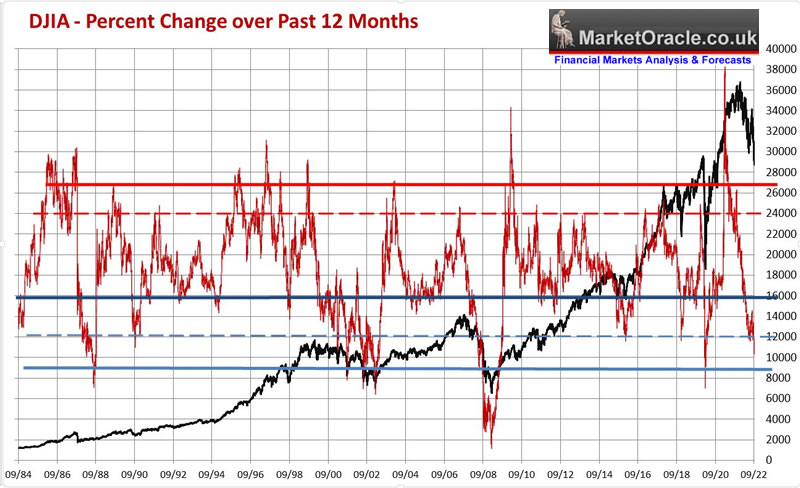
Dow Annual Percent Change
In my extensive analysis of September 2021 this indicator warned to expect the Dow to drop to 28k, the low to date has been 28.7k! For the bull market proper to resume this indicator needs trade above the thick black line, until then the market remains in no mans land of trading within range with the risks of worse to come. Most probable is the market trades in a range i.e. to trade above the blue dotted line, until the market has worked through it's bear phase. At this point I am discounting a re-run of 2008, as so far the indicator is showing a tendency to remain above the grey line, however this also implies that the bull market proper could be as much as a year away! In terms of price, the Dow is not going to see a new all time high anytime soon, probably beyond the end of 2023.
Stock Market Volatility (VIX)
This stocks bear market has been far less volatile than previous bear markets where the often voiced wait for capitulation moment has just flat out failed to materialise i.e. a VIX spike to above 45, instead each new low has failed to even reach 40. Nor is the significance of any decline reflected in the VIX peaks. So whilst many inexperienced investors may cry crash and collapse in fear on every down day, however this stocks bear market has so far been highly orderly, technical even as though a machine intelligence is at work behind the scene milking the market of money like a cash cow. The VIX range of 35 to 20 is very orderly given MSM and blogosfear noise, too calm for my liking i.e. most of the swings have not been volatile enough to capitalise upon.
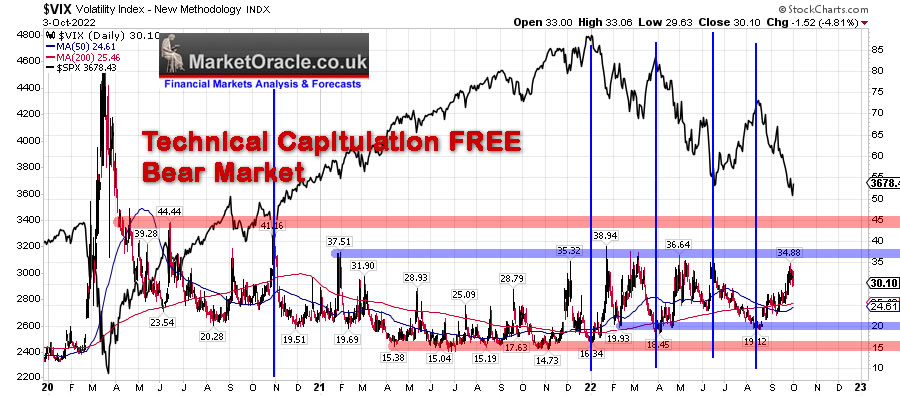
What this means is that all those waiting for that capitulation moment will likely continue waiting all the way to NEW ALL TIME HIGHS! This bear market is NOT acting like a bear market! The price action appears engineered so as to allow the dark pools of capital to stealthily accumulate at the hands of the weak hands, those who joined the investing craze in recent years, encouraged to take on leverage who are now being fleeced of all of their paper profits and more!
There is no sign that the capitulation moment that many are waiting for is going to happen, hence all those who BET on such an outcome will continue to LOSE money as their PUT options expire worthless.
Stocks and 10 Year Bond Yields
The consensus view is that falling bond yields are good for stocks. However that is not accurate, what stocks like is mildly falling OR rising bond yields. What stocks do not like is what we have witnessed since the start of the year, that is fast moving bond yields as the bond bubble burst in the wake of HIGH INFLATION.
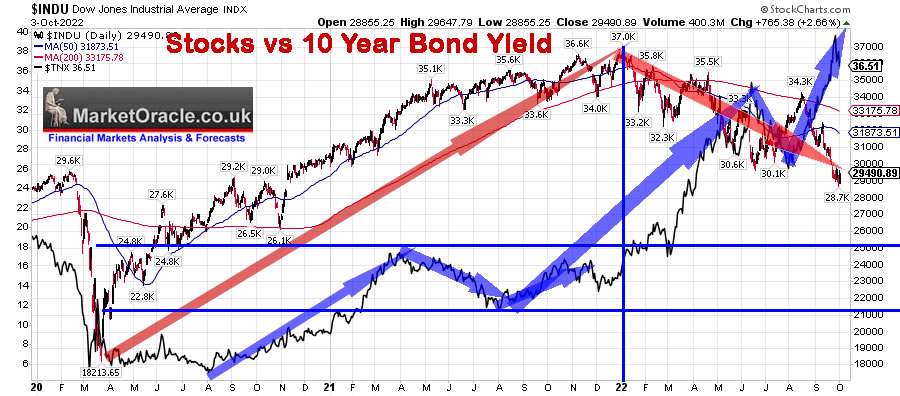
Therefore the pattern one needs to witness is for BOND YIIELDS peaking, stabilising and entering a shallow downtrend, that is what is best for stocks. Are we gong to get that? I doubt it. But the overall trend pattern suggests that bonds are in capitulation of sorts which will punctuate in peak rates that should give stocks a TEMPROARY BOOST, i.e. bond yields will peak and then FALL at a rapid pace! And that is the problem because bonds are a competing asset class to stocks. So becareful what you wish for, rapidly falling yields are NOT bullish for stocks!
At best stock investors can hope for is a mild trend lower in yields which given that inflation should remain well above the Fed's 2% target is probably what is gong to happen and therefore should at least act to put a floor under the stock market during 2023.
What this implies is that after the initial ergophobia of peak rates, probably during Q2 of 2023, stocks will be WEAK as rates fall as investors switch to capitalise on rising bond prices as the US economy continues to weaken. Though I doubt we will see the price of 2022 repeat i.e. I doubt we we will see lower lows despite rising bond prices a net negative for stocks however they also act to be supportive of stock prices in the longer-run which stocks tend to discount in the present by looking beyond the recession..
I am NOT a bond investor, not my cup of tea but given what is likely to transpire I am investigating some limited exposure to bonds going into 2023, and given that I reside in the UK, the following two bond funds are on my radar IBTM and IBTL. I am not expecting huge return, maybe in the region of 10% to 20% after f/x. Definitely not for the long-run, more a range trade as I do with stocks such as GSK, but at least it gets me a little more out of sterling into something that should beat UK Inflation.
SEASONAL ANALYSIS
This analysis continues in Stock Market Trend Forecast October 2022 to December 2023
Again this article is part 5 of 6 excerpts form my extensive analysis that concludes in detailed stock market trend forecast into the end of 2023 Stock Market Trend Forecast October 2022 to December 2023 that was was first made available to patrons who support my work.So for immediate first access to ALL of my analysis and trend forecasts then do consider becoming a Patron by supporting my work for just $4 per month, which is soon set to rise to $5 per month for new signup's so lock in now at $4 per month. https://www.patreon.com/Nadeem_Walayat.
Most recent analysis includes -
- Santa Battles Grinch to Deliver Stock Market Last Gasp Rally into the New Year
- Santa Sledge on the Launch Pad for Stock Market Post CPI To the Moon Rally
- Stocks Analysis Bonanza - GOOG, QCOM, ASML, TCHEY, BABA, BIDU, TSLA, WDC, RBLX, MGNI, COIN, BITCOIN CAPITULATION!
- How High Could the Impossible Stocks Bull Market Fly Into Christmas 2022
- Stock Market Cool as a Cucumber Despite Earnings and Fed Noise
- Intel Empire Strikes Back! The IMPOSSIBLE Stocks Bull Market Begins!
- Stock Market White Swan - Why Fed Could PAUSE Rate Hikes at Nov 2nd Meeting, Q4 Earnings
- Stocks Bear Market Max PAIN - Trend Forecast Analysis to Dec 2023 - Part1
- Stock Market Analysis and Trend Forecast Oct 2022 to Dec 2023
So for immediate first access to to all of my analysis and trend forecasts then do consider becoming a Patron by supporting my work for just $4 per month. https://www.patreon.com/Nadeem_Walayat.
My Main Analysis Schedule:
- UK House Prices Trend Forecast - Complete
- Stock Market Trend Forecast to December 2023 - Complete
- US House Prices Trend Forecast - 80%
- Global Housing / Investing Markets - 50%
- US Dollar / British Pound Trend Forecasts - 0%
- High Risk Stocks Update - Health / Biotech Focus - 0%
- State of the Crypto Markets
- Gold and Silver Analysis - 0%
- How to Get Rich - 85%

Again for immediate access to all my work do consider becoming a Patron by supporting my work for just $4 per month. https://www.patreon.com/Nadeem_Walayat. Lock in now as this increases to $5 per month in the new year.
And ensure you are subscribed to my ALWAYS FREE newsletter for my next in-depth analysis.
Your seeing if earnings will deliver any buying opps in target stocks analyst.
By Nadeem Walayat
Copyright © 2005-2022 Marketoracle.co.uk (Market Oracle Ltd). All rights reserved.
Nadeem Walayat has over 30 years experience of trading derivatives, portfolio management and analysing the financial markets, including one of few who both anticipated and Beat the 1987 Crash. Nadeem's forward looking analysis focuses on UK inflation, economy, interest rates and housing market. He is the author of five ebook's in the The Inflation Mega-Trend and Stocks Stealth Bull Market series that can be downloaded for Free.


 Nadeem is the Editor of The Market Oracle, a FREE Daily Financial Markets Analysis & Forecasting online publication that presents in-depth analysis from over 1000 experienced analysts on a range of views of the probable direction of the financial markets, thus enabling our readers to arrive at an informed opinion on future market direction. http://www.marketoracle.co.uk
Disclaimer: The above is a matter of opinion provided for general information purposes only and is not intended as investment advice. Information and analysis above are derived from sources and utilising methods believed to be reliable, but we cannot accept responsibility for any trading losses you may incur as a result of this analysis. Individuals should consult with their personal financial advisors before engaging in any trading activities.
Nadeem Walayat Archive |
© 2005-2022 http://www.MarketOracle.co.uk - The Market Oracle is a FREE Daily Financial Markets Analysis & Forecasting online publication.