


Stock Margin Debt, Market Breadth and Investor Sentiment Analysis
Stock-Markets / Stock Market 2023 Dec 14, 2022 - 08:30 PM GMTBy: Nadeem_Walayat

Will there be an Early Fed Pivot?
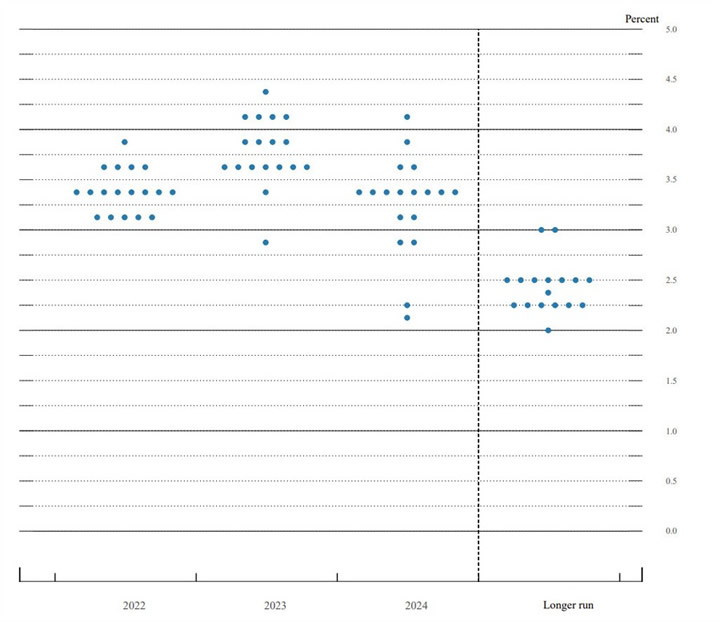
Well all of these dollars flooding into the US are going to push up asset prices / generate economic activity, so a strong dollar is also acting to mute the Fed's actions and thus Jerome Powell could deliver on what his dot plot implies i.e. that the Fed funds rate rises to 4.75% during Q1 2023 which means continuing dollar strength and pain for most economies and downwards pressure on stock prices. Though stock prices tend to discount the future and so are factoring in the possibility of 4.75% in today's stock prices rather than wait for March 2023, following which the Fed's Dots suggest rates falling to 2.5%. Though the Fed dot plots are virtually always wrong 1 year out.
And then we have the risk of CONTAGION PANIC! As demonstrated by what happened in the UK, what does the Fed fear more than inflation? It's banking crime syndicate brethren going bankrupt as the Fed full well knows that the banks and apparently pension funds as well continue lay huge bets on interest rates and other markets. Thus the Fed will be factoring in the risk of CONTAGION and know there is a limit to the extent it can push interest rates higher, so the dot plot is a case of fear mongering that rates could keep climbing to as high as 5,75% in attempts to reign in Inflation through FEAR induced economic contraction. So most probable is that the Fed Funds rate tops out at no higher than 4%, but before then we likely have one more a 0.75% rate hike early November after which the market will be focused on peak rates and then rate cuts as the US economy slows during 2023 for which there will be countless indicators which suggests higher stock prices during the first half of 2023, until the recession bites and earnings contract sending stocks lower.
So Interest rates suggest, a volatility into the November Fed meeting, a bull run into Mid 2023 and then down into the recession. And should the market get any whiff of an early Fed taper than stocks will soar!
This article is part 4 of 6 excerpts form my extensive analysis that concludes in detailed stock market trend forecast into the end of 2023 Stocks Bear Market Max PAIN - Trend Forecast Analysis to Dec 2023 which was first made available to patrons who support my work.So for immediate first access to ALL of my analysis and trend forecasts then do consider becoming a Patron by supporting my work for just $4 per month, which is soon set to rise to $5 per month for new signup's so lock in now at $4 per month. https://www.patreon.com/Nadeem_Walayat.
PART ONE: Stock Market Trend Forecast October 2022 to December 2023
Keep Calm and Carry on Buying Quantum AI Tech Stocks
Stock Market AI mega-trend Big Picture
Stock Market 2022 Trend Current Expectations Review
Feeding the Beast
Quantum AI Tech Stocks Portfolio
STOCK MARKET DISCOUNTING EVENTS BIG PICTURE
US Economy and Stock Market Addicted to Deficit Spending
The Inflation Mega-trend
US Economy Has Been in an Economic Depression Since 2008
WHY PEAK INFLATION RED HERRING
US interest Rates and Inflation
Inflation and Interest rates Implications for the Stock Market
TIPS BONDS INFLATION PROTECTION
FED Balance Sheet
SMASHED Bond Market Brewing Opportunity
Stocks and Inverted Yield Curve
US Dollar Big Picture
US Dollar Strength Implications for Global Economies
Financial Crisis 2.0 and Interest Rates
UK Economy and British Pound Trend Forecast
RECESSIONS 2023
The Stock Market Recession Pattern
PART TWO: Stock Market Trend Forecast October 2022 to December 2023
Will there be an Early Fed Pivot?
Why Most Stocks May Go Nowhere for the Next 10 Years!
Valuation Reset and Future EPS
Margin Debt
Answering the Question - Has the Stocks Bear Market Bottomed?
Stock Market Breadth
Stock Market Investor Sentiment
Dow Short-term Trend Analysis
Dow Long-term Trend Analysis
ELLIOTT WAVES
Dow Annual Percent Change
Stock Market Volatility (VIX)
Stocks and 10 Year Bond Yields
SEASONAL ANALYSIS
Correlating Seasonal Swings
Major Market lows by Calendar Month
US Presidential Cycle
Best Time of Year to Invest in Stocks
Formulating a Stock Market Trend Forecast
Dow Stock Market Trend Forecast September 2022 to December 2023
Most recent analysis includes -
- Santa Sledge on the Launch Pad for Stock Market Post CPI To the Moon Rally
- Stocks Analysis Bonanza - GOOG, QCOM, ASML, TCHEY, BABA, BIDU, TSLA, WDC, RBLX, MGNI, COIN, BITCOIN CAPITULATION!
- How High Could the Impossible Stocks Bull Market Fly Into Christmas 2022
- Stock Market Cool as a Cucumber Despite Earnings and Fed Noise
Why Most Stocks May Go Nowhere for the Next 10 Years!
Here's why PE ratio's matter as the following chart shows the return 10 years forward from the starting average PE i.e if the stock market is trading on an average PE of 27 than can basically be expected to go nowhere for the next 10 years. Whilst the lower the PE the higher the expected return (on average), where the safe zone for investing is at a starting PE of between 10 and 20. Note graphs is as of September 2021, see below for updated ratios.
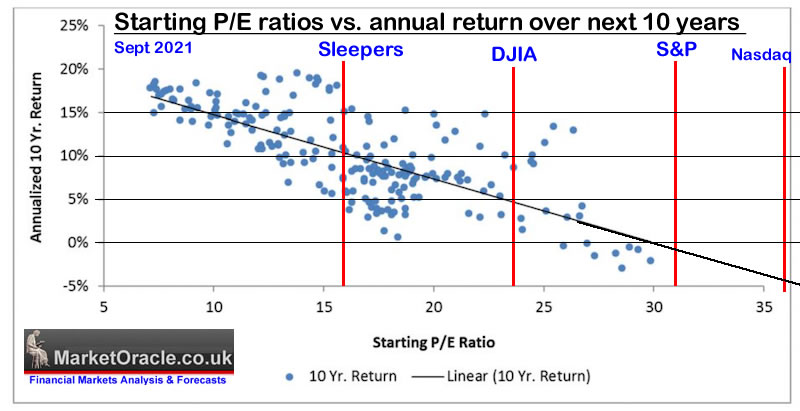
The current PE ratios vs where they were a year ago :
- DJIA 17.4 / 23.66 (74%)
- Dow Transports 11.8 / 57.25 (21%)
- Nasdaq 22.9 / 36.35 (63%)
- S&P500 17.8 / 31.41 (57%)
- AI portfolio Top 6 AI stocks 18.8 vs 42 (45%)
- AI portfolio Top 10 AI stocks 16.5 vs 37(45%)
- AI Sleepers 9 vs 15.8 (57%)
- AI Portfolio 21 stocks - 16.2 vs 28.8 (56%)
The AI stocks portfolio has delivered both to the upside and now to the downside i.e. stock prices FOMO'd during 2021 to ridiculously high valuations and then collapsed all the way to BELOW the indices during 2022 which now makes most dirt cheap because you know what's going to happen during the next bull market, rinse and repeat ;)
The bottom line is AI tech stocks cycle between over valuation and under valuations where today the stocks trade SUB indices, so whilst the indices may go nowhere, the AI tech stocks definitely will once more reach a state of over valuation as 2021 illustrates. Whilst today the same investors who were FOMO-ing when I was SELLING are now waiting for the CRASH in the indices all whilst AI tech stocks enter into a STEALTH bull market which will leave most gob smacked as to how the hell did the tech stocks they were waiting to buy recoup most of their bear market declines.
Valuation Reset and Future EPS
Stock markets trend between a state of over valuation and under valuation in earnings terms, hence my warnings to expect a valuation reset during most of the second half of 2021 which means regardless of what happens to the economy THIS bear market WAS inevitable! And it HAS come to PASS to great extent where many of the most over valued stocks have HALVED in price and not just the usual suspects but the likes of AMD and TSMC! AMAZON! And so on.
August 2021- AI Stocks Portfolio Buying and Selling Levels, Bubble Valuations 2000 vs 2021
Amazon to the MOON 2021! Then what?
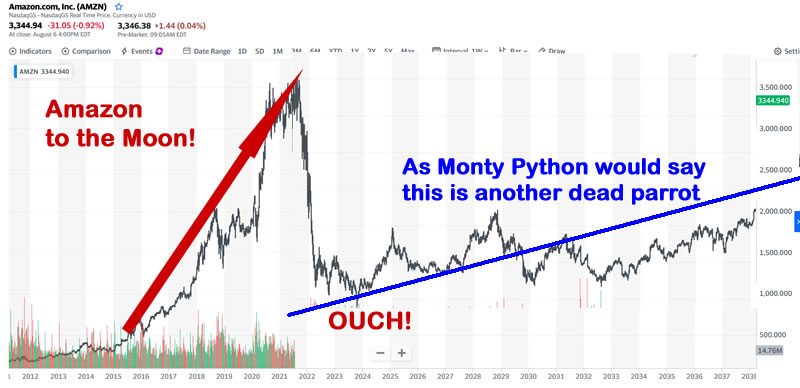
YES, Apple, Amazon, Facebook, Google and Nvidia all have highly compelling reasons for why they should all continue keep going to the MOON! But so did all of the tech giants in 2000!
So in some months time we may be living in a completely different world where the likes of Microsoft, Amazon and Apple after a plunge in price have most investors who were happy to pile in at all time highs with their dollar cost averaging mantra are then too scared to either buy or sell as they watch in fear stock market armageddon take place all whilst the MSM, blogosFear and Youtubers reinforce their state of paralysis acting as echo chambers just regurgitating that which others have posted.
As for what I will be doing ? BUYING the PANIC! Even if I turn out to be early because during the mayhem most of the pieces of the puzzle will be unknown.
The valuation reset is the rotation out of over valued growth stocks the pinnacle of which populate Cathy Wood's ARK funds and into under valued low PE usually dividend paying stocks as the following illustrates for the Russell Small cap stocks where high value stocks were bid up to to fever pitch ridiculous valuations whilst the value stocks were largely neglected by the market this is what the valuation reset looked like 8 months ago.when I warned that AI tech stocks had much further to fall -
As you can see we are a long way from the value reset from running it's course so this could play out for most of 2022. Where our AI tech stocks are concerned this translates into the higher the PE stocks facing greater downwards pressure for the likes of Nvidia, AMD, Microsoft and Amazon.
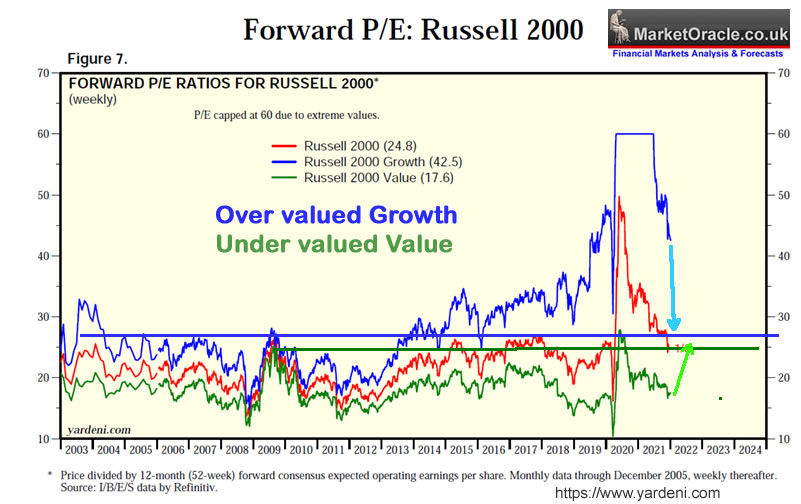
And here is the current state of the valuation reset -
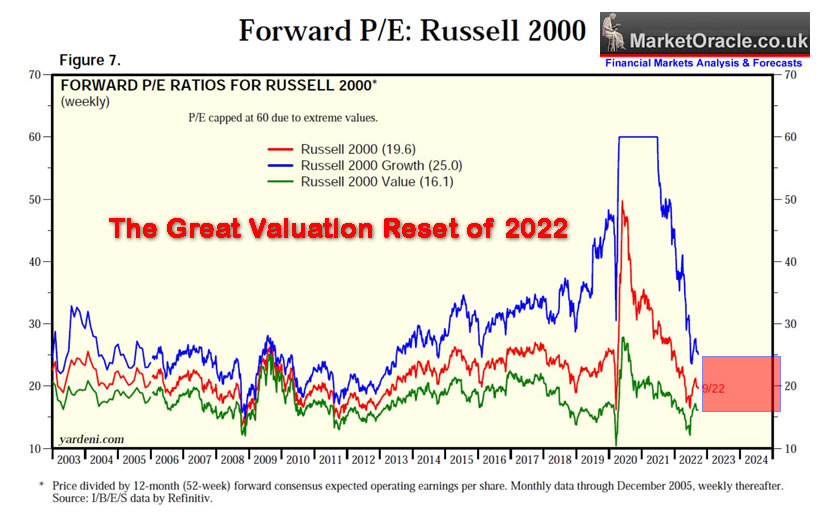
The great valuation reset of 2022 is in it's last legs! Whilst not complete i.e. the gap has yet to shrink further where the indices are concerned, however on a stock by stock basis many of the target stocks HAVE reset whilst a few such as Apple and Microsoft remain pending that will likely either under perform or suffer their valuation reset moment in due course over the coming months, hence why I am reluctant to increase my exposure to such stocks, especially Apple and Amazon.
Going forward the name of the game will be to allow earnings to play catchup to prices, thus whilst the remainder of this year will enjoy a powerful bull run, given the earnings outlook for 2023 then we cannot expect target stocks to return to new all time highs anytime soon, definitely not during 2023. So it is very unlikely that stocks or indices will trade anywhere near their all time highs during 2023, instead more probable is a trading range as earnings play catch up to prices. Note I do not subscribe to the collapse in earnings thesis for it fails to account for the impact of HIGH inflation which AI tech stocks are leveraged to i.e raise their earnings at a rate in excess of inflation.
Margin Debt
Margin debt tends to peak and fall long before the stock market turns lower as basically speculators start to feel the pain of holding losing positions and thus cut back on their bets. Either that or are forced to close their losing trades due to failure to meet margin calls, in which respect this indicator proved very useful in flagging the prospects for a bear market long before it materialised as stock prices trended higher on petrol fumes as the fuel tank was empty.
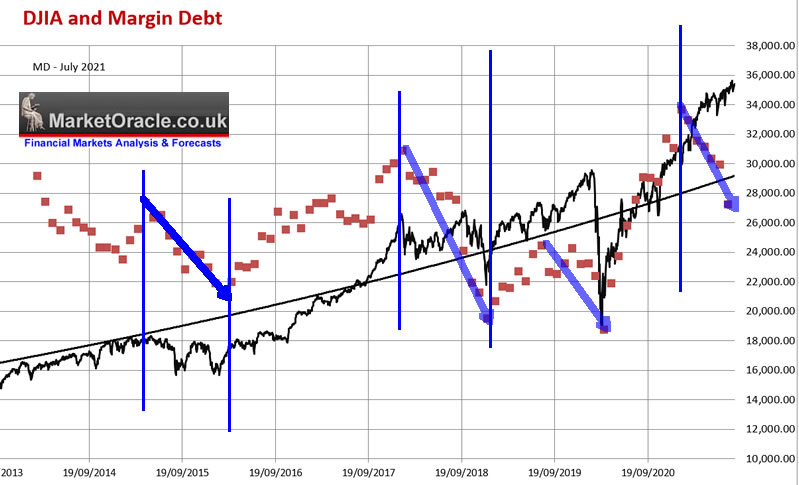
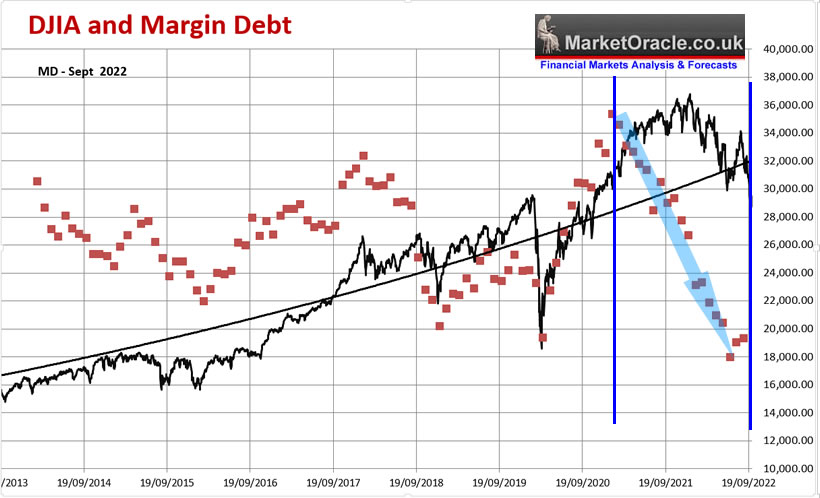
All those who are still waiting for capitulation are looking for it in the wrong place, here's your capitulation! Margin debt collapsed to rock bottom as burned investors were kicked out of their FOMO / Buy the dip leveraged positions! September data which will likely show a new low in margin debt! Yes falling margin IS BEARISH for stock prices. However this trend is primed for reversal as we saw during August it does not take much expansion in margin debt to feed a bull market. The observed pattern is that margin debt FALLS before the indices peak and bottom WITH the indices, This is because those investing on the basis of margin tend to gamble in higher risk more volatile stocks that tend to start their decent long before the indices. Whilst bottoms tend to occur with the Margin debt lows, the current low is indicative of the degree to which this bear market has wiped out the leveraged investors.
HEED MY WARNING - NEVER INVEST ON LEVERAGE! For one CANNOT INVEST AND FORGET WHEN USING LEVERAGE!
Answering the Question - Has the Stocks Bear Market Bottomed?
Has the BEAR market Bottomed? That is the question I am most often asked for the duration of this bear market, where my earlier responses were that my focus was on accumulating target stocks as they DEVIIATE FROM THEIR HIGHS TO NEW LOWS, so where the indices actually bottom is largely irrelevant. Still this is the most asked question so following the June bottom my stance changed to the bottom is probably in for most target stocks, though I cannot say the same for the indices. However in the run up to 4180 I had penciled in a subsequent bear swing target of between 3720 to 3920 for a probable higher low, which means that June was probably the bottom. Subsequent price action continued to suggest that the bottom is in e where the key indicator was the breakout above 4200, it was not an intraday move or a few shallow spikes above 4200, Instead the S&P rocketed higher by over 110 points in a 3 day run from 4200 to 4317 that acted as a strong indicator that 3637 was the bottom, though it could mean we miss out on some AI cherries.
However, the bottom is in is also based on my past studies that suggest a 50% reversal from the bear market lows usually act as a strong indication of the bottom being in which is the focus of this analysis that acts as a further excerpt from my forthcoming in-depth analysis that I have hit the pause button on for 1 week as I venture out of my castle for the first time in 6 months to travel to Wales for some sun, sea and sand and perhaps see if I can find Excalibur in one of it's many lakes that follows the slow recovery form my March ruptured Achilles tendon injury that revealed the extent to which the NHS is a JOKE Health Service when one actually has the misfortune to use it.
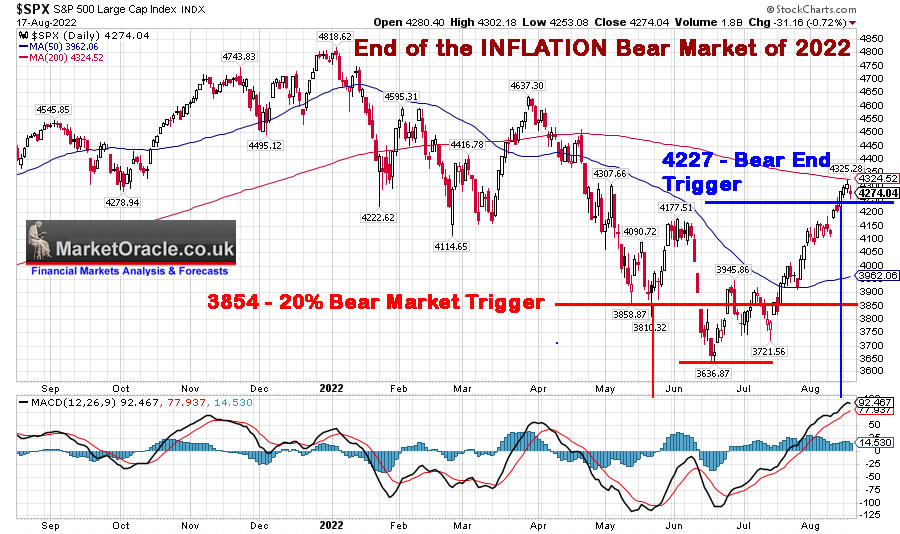
The Great Inflation Bear Market of 2022
Firstly bear markets need to be triggered for one to start contemplating a reversal signal which thus requires a 20% drop, this analysis is focused on the S&P as I slowly trend away from analysis of the Dow.
Summary of the Bear Market END Indicator.
1. Bear Market triggered after a 20% drop
2. Stock market rallies beyond 50% of the Bull high to bear low range .
Note this is obviously not a trading or investing indicator but solely seeks to answer the question is the Bear Market Over?
The S&P topped at 4818, 20% bear market trigger was at 3854, subsequent lowest point of the bear market was at 3637, 50% advance from equals 4227, thus should the S&P break above 4227 then that indicates that the bear market is over and thus whatever follows in terms of the next swing down, it should NOT break the June 3667 low, instead set a higher low. As you are probably all aware the S&P DID break above 4227 last Friday and thus implies that the bear market is over and thus one should position oneself accordingly know that the probability of the S&P breaking below 3637 during the remainder of this year is very low.
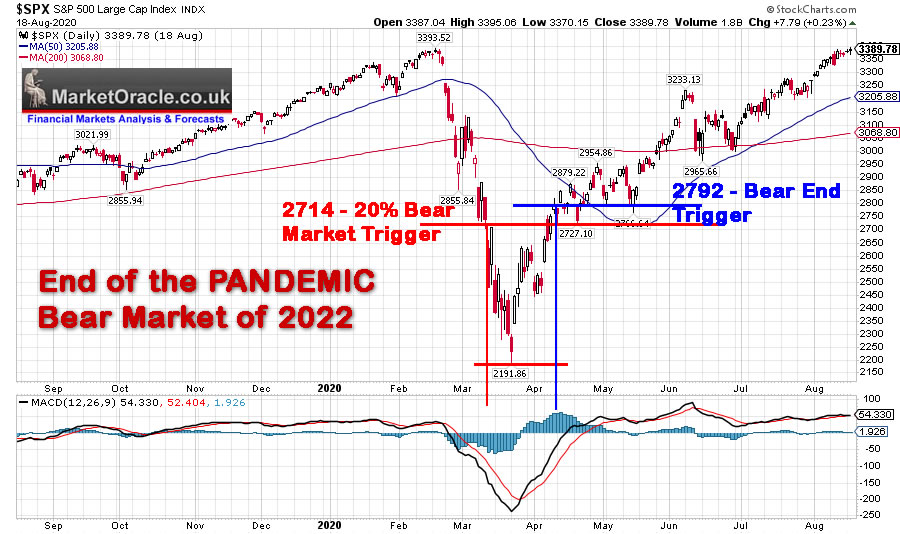
The Pandemic Bear Market of 2020
The S&P topped at 3393, 20% bear market trigger was at 2714, subsequent lowest point of the bear market was 2192, 50% advance from equals 2792, thus signaled the end of the Pandemic bear market on a break above 2972, which was followed by a 60% advance on the 50% trigger level to the next bull market peak.
GFC Bear Market of 2007 to 2009
The S&P topped at 1576, 20% bear market trigger was at 1260, subsequent low of the bear market was 1257, 50% advance from equals 1416, which was triggered during MAY 2008 so one can either treat the 3 month rally as a tiny bull market or more accurately as a FALSE signal. A lesson that If the housing market goes gaga you can forget about a stocks bear market bottom!
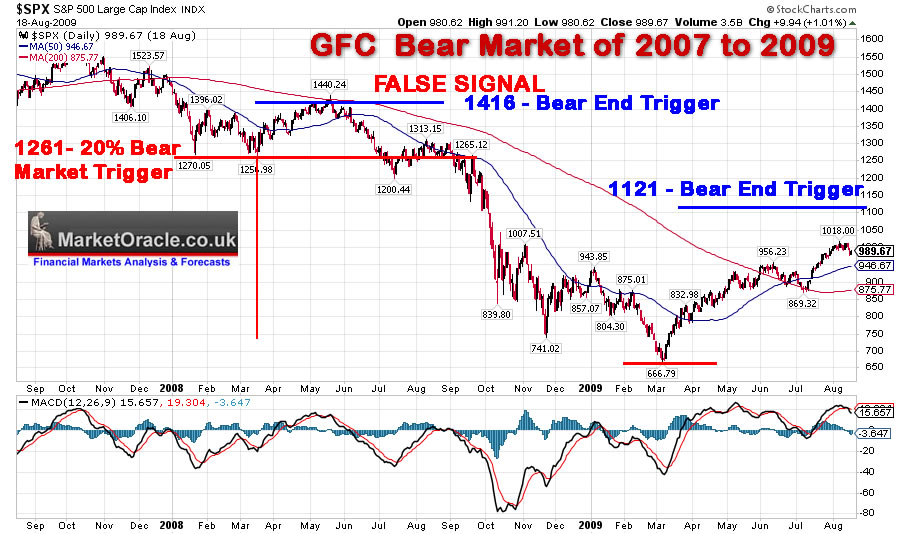
The actual end of the bear market trigger came some 18 months later during 2009 on break above 1121 off of the 667 low.
The Dot Com Bust Bear Market of 2000 to 2003
This market was very volatile that witnessed very powerful counter trend rallies. However, despite a series of powerful up swings NOT once resulted in a FALSE End of the Bear Market trigger.The S&P topped at 1553 in March 2000, following which the volatile bear market did not trigger a reversal until the rally off the 768 low to above 1160 early 2004 which acted to confirm that the bear market was over following which the bull run continued for another 3 years to 1576.
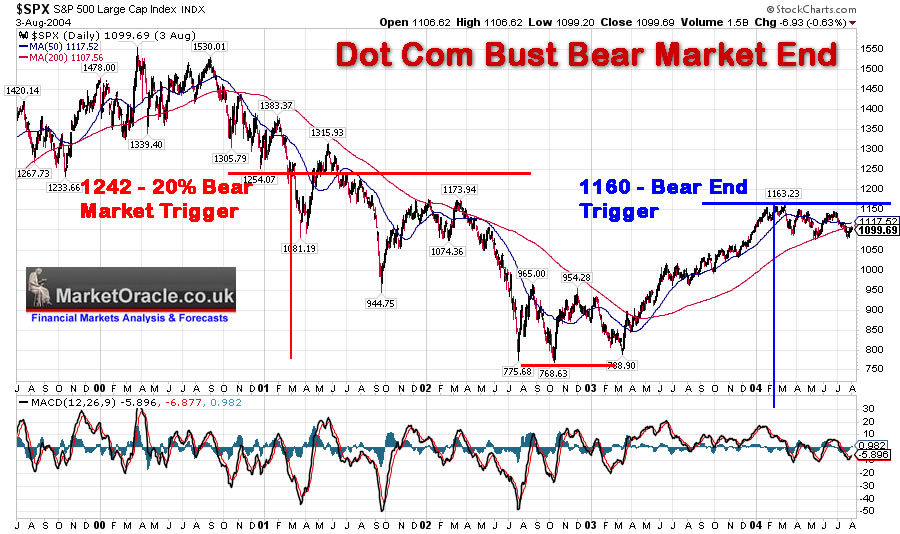
(Charts courtesy of stockcharts.com)
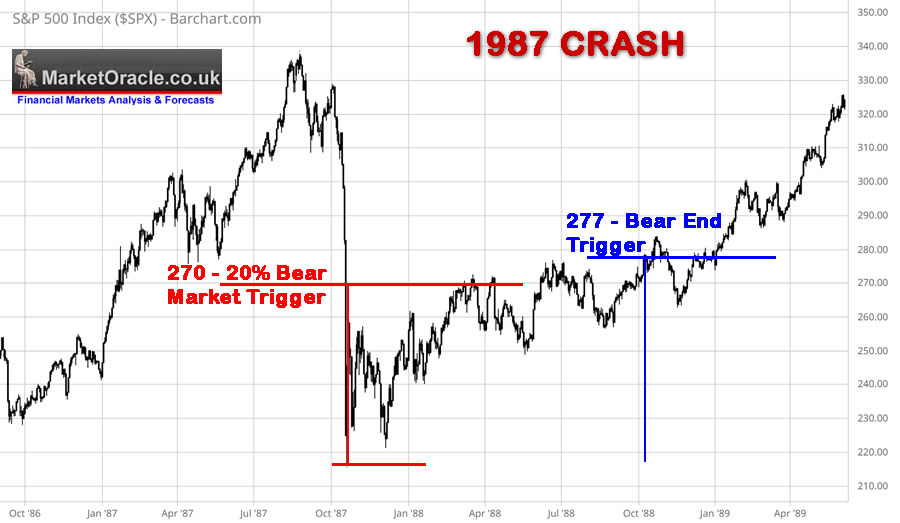
1987 CRASH
August top at 338, bear triggered during Black Monday on break below 270, bear market low at 216.6, 50% trigger 277 triggered a year later in October 1988, then the S&P X6 over next 12 years.
So to answer the question has the bear market ended?
There is a 80% probability that the bear market has ended, though we will get a retest of sorts for which there is a 20% that it will break the June low.
And once more this is a "Has the Bear Market ENDED" Indicator, it is not a trading or investing signal as ones objective is to accumulate during the bear market at prices that are significantly below this trigger price i.e. at well below S&P 4227 for which we should see further opportunities to do so in the run up to the mid-term election chaos.
The bottom line is this - THE BOTTOM happens on ONE day, whilst the BULL MARKET runs for several years which is where the money is actually made, therefore all those who ask the question is this the bottom are asking the WRONG QUESTION as THE BOTTOM is a RED HERRING It is a function of investors having the WRONG MINDSET, the bottom is IRRELEVANT! What matters is when you look back in the rear view mirror at the bottom is to ask yourselves are you invested or not? Because most investors have brainwashed into only trying to buy the bottom so what happens afterwards ensures they will be invested in little worth holding, why I personally could not careless where the bottom is, only thing I care about is in achieving my target to reach 85% invested, which I have as of Friday 30th September.
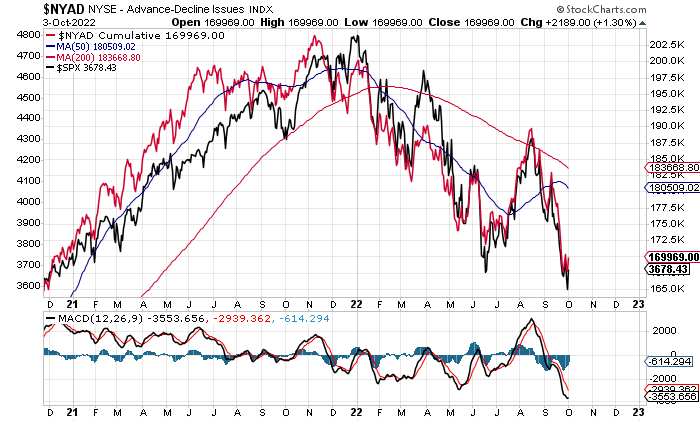
Stock Market Breadth
Cumulative NYSE Advancing / Declining issues proved a useful early warning indicator going into the stock market top, since which has closely tracked the markets decline so is not showing any obvious positive nor negative deviation, a case of continuing to keep ones eye on it for a similar cues.
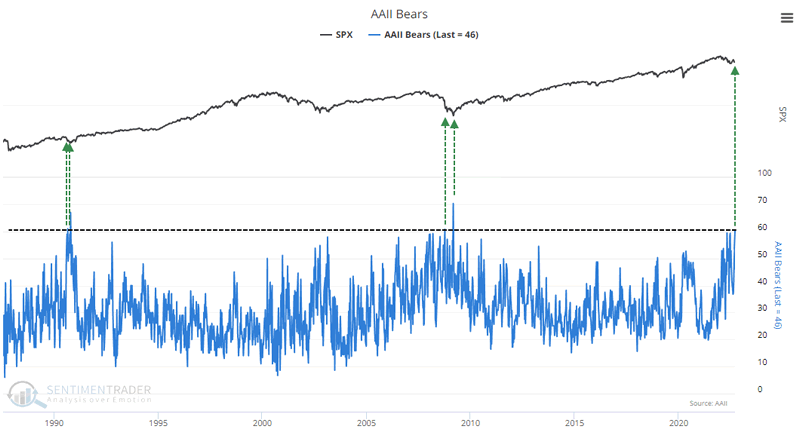
Stock Market Investor Sentiment
Apparently today's stock market sentiment is the most bearish since the March 2009 low! Which implies the end of the bear market is imminent. However there could be a double dip lower low.
DJIA Stock Market Technical Trend Analysis
This analysis continues in 2 - Stock Market Trend Forecast October 2022 to December 2023
Again this article is part 4 of 6 excerpts form my extensive analysis that concludes in detailed stock market trend forecast into the end of 2023 Stock Market Trend Forecast October 2022 to December 2023 that was was first made available to patrons who support my work.So for immediate first access to ALL of my analysis and trend forecasts then do consider becoming a Patron by supporting my work for just $4 per month, which is soon set to rise to $5 per month for new signup's so lock in now at $4 per month. https://www.patreon.com/Nadeem_Walayat.
Most recent analysis includes -
- Santa Sledge on the Launch Pad for Stock Market Post CPI To the Moon Rally
- Stocks Analysis Bonanza - GOOG, QCOM, ASML, TCHEY, BABA, BIDU, TSLA, WDC, RBLX, MGNI, COIN, BITCOIN CAPITULATION!
- How High Could the Impossible Stocks Bull Market Fly Into Christmas 2022
- Stock Market Cool as a Cucumber Despite Earnings and Fed Noise
- Intel Empire Strikes Back! The IMPOSSIBLE Stocks Bull Market Begins!
- Stock Market White Swan - Why Fed Could PAUSE Rate Hikes at Nov 2nd Meeting, Q4 Earnings
- Stocks Bear Market Max PAIN - Trend Forecast Analysis to Dec 2023 - Part1
- Stock Market Analysis and Trend Forecast Oct 2022 to Dec 2023
So for immediate first access to to all of my analysis and trend forecasts then do consider becoming a Patron by supporting my work for just $4 per month. https://www.patreon.com/Nadeem_Walayat.
My Main Analysis Schedule:
- UK House Prices Trend Forecast - Complete
- Stock Market Trend Forecast to December 2023 - Complete
- US House Prices Trend Forecast - 80%
- Global Housing / Investing Markets - 50%
- US Dollar / British Pound Trend Forecasts - 0%
- High Risk Stocks Update - Health / Biotech Focus - 0%
- State of the Crypto Markets
- Gold and Silver Analysis - 0%
- How to Get Rich - 85%

Again for immediate access to all my work do consider becoming a Patron by supporting my work for just $4 per month. https://www.patreon.com/Nadeem_Walayat. Lock in now as this increases to $5 per month in the new year.
And ensure you are subscribed to my ALWAYS FREE newsletter for my next in-depth analysis.
Your seeing if earnings will deliver any buying opps in target stocks analyst.
By Nadeem Walayat
Copyright © 2005-2022 Marketoracle.co.uk (Market Oracle Ltd). All rights reserved.
Nadeem Walayat has over 30 years experience of trading derivatives, portfolio management and analysing the financial markets, including one of few who both anticipated and Beat the 1987 Crash. Nadeem's forward looking analysis focuses on UK inflation, economy, interest rates and housing market. He is the author of five ebook's in the The Inflation Mega-Trend and Stocks Stealth Bull Market series that can be downloaded for Free.


 Nadeem is the Editor of The Market Oracle, a FREE Daily Financial Markets Analysis & Forecasting online publication that presents in-depth analysis from over 1000 experienced analysts on a range of views of the probable direction of the financial markets, thus enabling our readers to arrive at an informed opinion on future market direction. http://www.marketoracle.co.uk
Disclaimer: The above is a matter of opinion provided for general information purposes only and is not intended as investment advice. Information and analysis above are derived from sources and utilising methods believed to be reliable, but we cannot accept responsibility for any trading losses you may incur as a result of this analysis. Individuals should consult with their personal financial advisors before engaging in any trading activities.
Nadeem Walayat Archive |
© 2005-2022 http://www.MarketOracle.co.uk - The Market Oracle is a FREE Daily Financial Markets Analysis & Forecasting online publication.