


How Much Longer Can the US Dollar Trade Last?
Currencies / US Dollar Sep 19, 2022 - 08:35 PM GMTBy: Richard_Mills

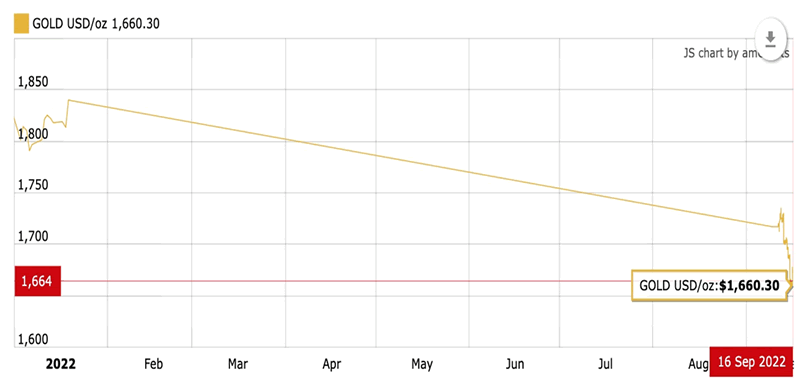
This year has seen a correction in the gold price, commensurate with rising interest rates, and the spectre of more to come. The precious metal has also been hammered by a strong US dollar, which is negatively correlated to the gold price.
Spot gold has fallen from about $1,800 an ounce at the start of the year, to $1,675 currently, a drop of 7.4%. On Thursday, Sept. 15, gold plunged to its lower level since April, 2020, on expectations of a 0.75% interest rate increase next week by the Federal Reserve.
“The gold market has clearly priced in a more aggressive US Federal Reserve ahead of next week’s meeting, reflecting the central bank’s determination to fight inflation,” Carsten Menke, head of next generation research at Julius Baer, a private Swiss bank, told Reuters.
In fact some are even calling for a 100-basis-point increase to the federal funds rate (+1%), due to perceived strength in the US job market. Applications for unemployment insurance fell for a fifth straight week, suggesting demand for workers is healthy.
The Fed has two responsibilities: to allow the economy to grow at a rate no faster than 2% inflation, and to set interest rates higher or lower to achieve this target; and to ensure that the economy is running at or near full employment. The central bank therefore keeps a close eye on inflation and unemployment figures.
If the Fed hikes by 1% instead of 0.75%, we’d expect gold to fall further.
As avid followers of the gold market, we are perplexed by what we are seeing currently. On the one hand, it makes sense that investors are shying away from gold due to higher interest rates. The latter is bumping up the value of the US dollar and dampening gold’s appeal. As US interest rates rise, so do government bond yields. Capital flows into the country attracted by higher yields, so the dollar goes up. Gold offers neither a yield nor a dividend, thus it is seen as a less attractive asset class to own, at the moment.
On the other hand, real interest rates are deeply negative, which should be good for gold. At time of writing, the real interest rate using the benchmark US 10-year Treasury yield is -4.85% (3.45% minus 8.3% inflation). Even if we use the Fed’s preferred inflation gauge, the personal consumption expenditure (PCE) price index, the real interest rate is -2.85% (3.45% minus 6.3%)
In this article we examine negative real rates and the dollar, to try and predict when the dollar trade might be replaced by the gold trade.
Negative real rates and gold
Several factors influence gold prices (mainly the US dollar, gold ETF inflows/ outflows, inflation rate, bond yields, safe haven demand, physical gold demand, gold supply) but none is more reliable than real interest rates.
The demand for gold moves inversely to interest rates — the higher the rate of interest, the lower the demand for gold, the lower the rate of interest the higher the demand for gold.
The reason for this is simple, when real interest rates (interest rate minus inflation) are low, at, or below zero, cash and bonds fall out of favor because the real return is lower than inflation. If you are earning 1.6% on your money from a government bond, but inflation is running 2.7%, the real rate you are earning is negative 1.1% — an investor is actually losing purchasing power. Gold is the most proven investment to offer a return greater than inflation, by its rising price, or at least not a loss of purchasing power.
Bond market and gold market observers keep a close eye on US Treasury yields, particular the yield on the benchmark 10-year note. This is because the 10-year serves as a proxy for other financial products, such as mortgage rates, and it also signals investor confidence. When there is low confidence in the economy, people want safe investments, and US Treasuries are considered among the safest. Demand for Treasuries bids up their prices and yields fall. Conversely, when confidence returns, investors dump their bonds, thinking they do not need to play it safe. This causes bond prices to sink and yields to climb.
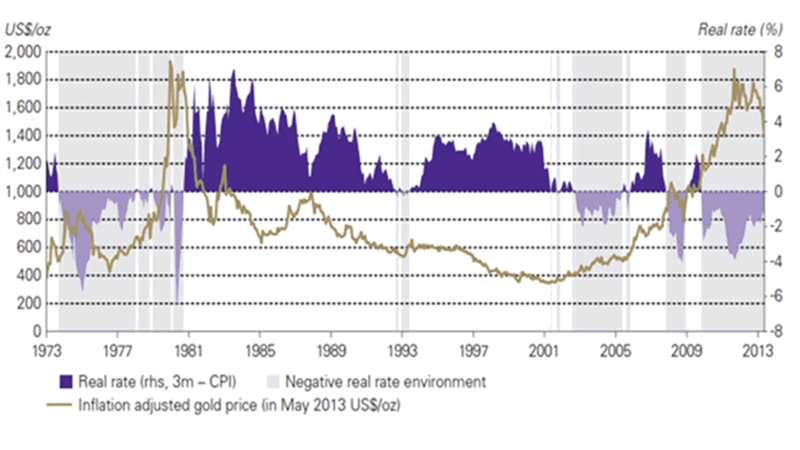
Historically, we can see the inverse relationship between negative real interest rates and gold, by charting the gold price and the 10-year Treasury yield after inflation.
In an article titled ‘The Golden Dilemma’, authors Claude Erb and Campbell found a near-perfect negative correlation of -0.82 (-1 being a perfect negative correlation) between real interest rates and gold prices between 1997 and 2012. Going back further in history, when real interest rates turned negative during the second half of the 1970s, gold moved as high as $1,900 an ounce, as real rates plummeted as low as -6%. When Paul Volcker, Fed Chair under President Carter and Reagan, hiked short-term nominal interest rates, real rates returned to positive, ending gold’s run. In fact, the gold price continued to drift downward, reaching a 30-year low under $400 an ounce in 2001. The gold bull market of 2010 to 2013 is easily seen in juxtaposition with negative real interest rates which bottomed out at around -4% during that same period.
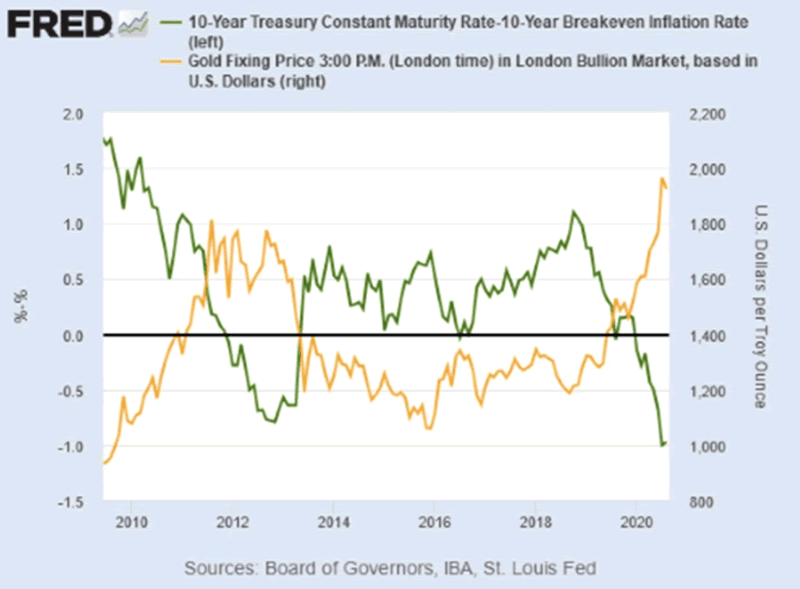
In the FRED chart below, notice that the gold price between 2013 and 2020 never gets above $1,400, corresponding to the period when the real yield on the 10-year is between about 0% and 1%. However, when real yields “go negative,” as they did around 2011-13, and in 2020, gold prices jumped.
2020’s 22% annual increase in the gold price was due to pandemic fears, combined with a low US dollar and plunging Treasury yields, causing real yields to go negative even though inflation stayed below 2%.
2020’s dramatic bond rally drove down yields across the world. On March 8, 2020, the US 10-year Treasury note reached an all-time low of -0.38%; two days earlier the German “bund” fell to a record -0.74%.
Investors piled into sovereign debt based on expectations of monetary stimulus like financial crisis-era easing programs that pushed down interest rates to zero and sparked a multi-year rally in stocks.
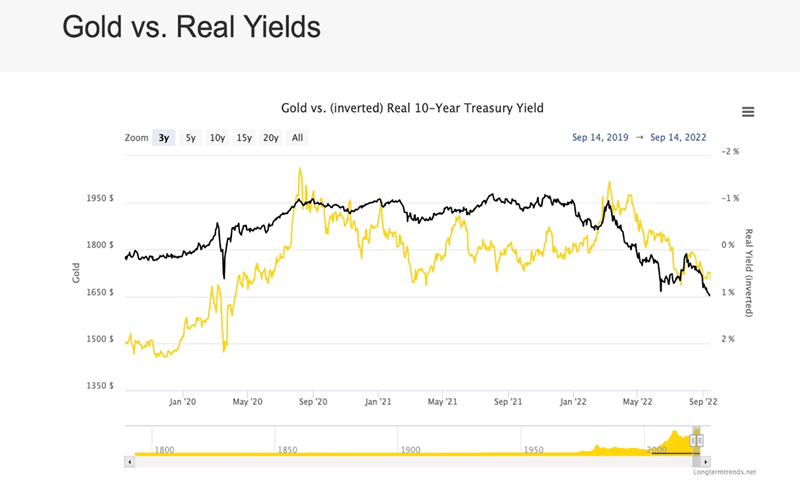
Bringing us up to date, the chart below shows the gold price peaking at its all-time high of $2,034/oz in August, 2020, when real yields were approaching -2%. Another gold spike occurred in March 2022, when the spot price briefly exceeded $2,000, corresponding with the war in Ukraine and the negative real yield increasing from around -0-.5% to -1%. Since then, the gold price has fallen in lock step with declining real yields.
Loser bonds
The rally came to an end earlier this year. Now we have a stock market correction happening at the same time as record-high inflation, the most in 40 years. The US Consumer Price Index (CPI) was 8.3% in August. Food prices last month were 11.4% higher than a year earlier, the most since 1979, and electricity was 15.8% more expensive. Labor Department data on Tuesday showed the headline CPI rising 0.1% from July, for a 27th straight month of rising inflation.
What does the current combination of high inflation and rising bond yields, mean for investors? To put it bluntly, the economics don’t add up. During covid, investors flocked to safe-haven assets like US Treasuries. This pushed down nominal yields to record lows, but inflation also collapsed due to the global economic slowdown. Real interest rates therefore held steady, as the chart below shows, the blue line at or near 0%.
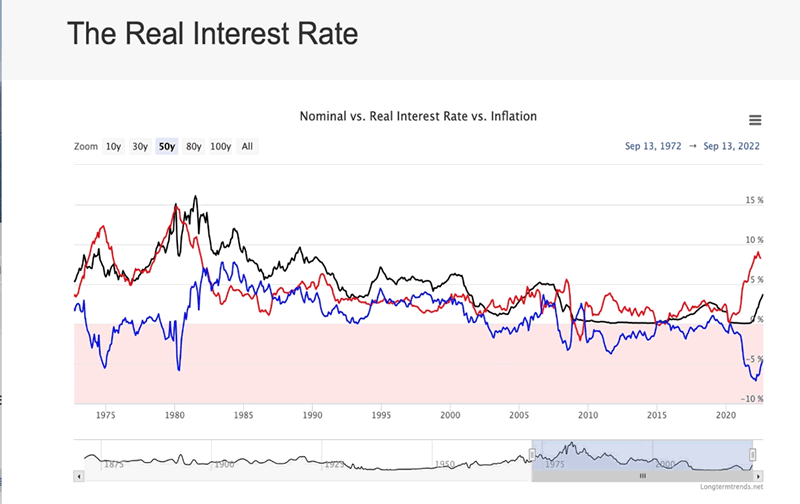
As economies opened up and growth restarted, demand for Treasuries waned and nominal yields rose. Falling bond prices and higher bond yields are a sign of investor optimism regarding the economy. Despite the current stock market palpitations and negative sentiment, many investors don’t believe the US is in a recession, and while one may be inevitable, due to rising interest rates, they think it will take longer to get there, the Wall Street Journal stated near the end of August.
However, those who bought this logic and decided to invest in bonds, are earning a very negative real return. Consider: an investor who on Friday purchased a 10-year Treasury note @ 3.45% will, at the current CPI of 8.3%, be losing 4.85% on this investment. This is seen in the chart above by real interest rates (the blue line) plummeting from 0% in 2020 to about -7%, then curling up to the current ~-5%. Note also that inflation, the red line, is negatively correlated to real interest rates, shown by the red line and the blue line diverging widely at present. Overall the chart shows that, adjusted for inflation, the yields on US Treasuries have often been negative.
According to Black Rock, foreign investors are among those who continue to “gobble up these negative real yielding assets”:
As the U.S. economy has reopened, imports of goods from other countries has increased significantly. Many of these exporting companies and countries have bought U.S. debt to build up their foreign exchange reserves.
Additionally, while nominal yields are low in the U.S., they are even lower in other parts of the developed world. Many foreign investors have been picking up U.S. Treasuries because of their (relatively) high yield.
Institutional investors like pension funds are also compelled to buy Treasuries, to fund their longer-term liabilities, while so-called “momentum players” use them to hedge their portfolios. Black Rock says its research shows that these momentum traders have recently shifted from going short (selling U.S. Treasuries), to going long (buying U.S. Treasuries). Once again, adding incremental demand.
The dollar trade
Besides negative real rates, the other major factor influencing gold is the US dollar. For more than a year, the buck has been gaining strength relative to other currencies, including the euro, yen, yuan and Canadian dollar. On Aug. 20 the US Dollar Index (DXY) briefly hit a 20-year high, and as the chart below shows, the index has been risen steadily all year.
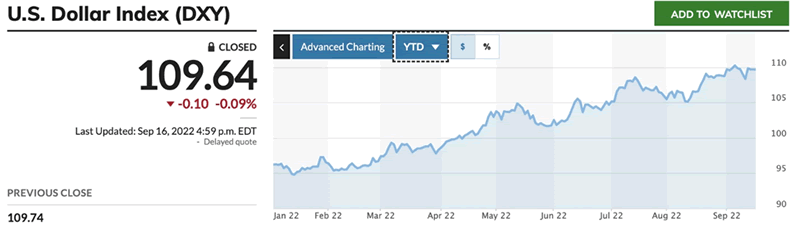
As mentioned, US Treasuries are a popular safe haven in times of stock market panic, and this has put upward pressure on the dollar, as foreign investors pour capital into the country. The dollar has also done well because the US economy is perceived to be stronger than Europe’s, which is suffering from an energy crisis. On Aug. 22 the euro fell to a two-decade low of 0.9903 against the dollar.
The New York Times went further in a July article, stating that the dollar is the strongest it’s been in a generation, and citing safe haven demand, inflation, higher interest rates and worries over growth as factors.
I have no problem admitting that the dollar trade is the only trade right now, with the US Federal Reserve and other central banks intent on raising interest rates. The question on my mind, though, is when the trade flips to gold.
The gold trade
Gold’s meteoric rise in 2020 corresponded with a major expansion of the money supply globally, as many central banks engaged in “quantitative easing” during the covid-19-induced recession. QE involves the purchase of government bonds by “printing money”. At the same time, central banks dropped their interest rates to zero, to encourage borrowing and economic activity. Low interest rates and expansionary monetary policy are always good for gold.
When a central bank uses this policy, it buys large amounts of government and corporate bonds. This increases the amount of money circulating in the economy, which helps lower long-term interest rates. This in turn reduces the cost of borrowing, which spurs economic growth.
To a large extent, it worked. Despite some tense moments, the global economy was saved from falling into a depression, and eventually the stock market recovered. However, the cost was a humongous increase in the Federal Reserve’s balance sheet, and the national debt.
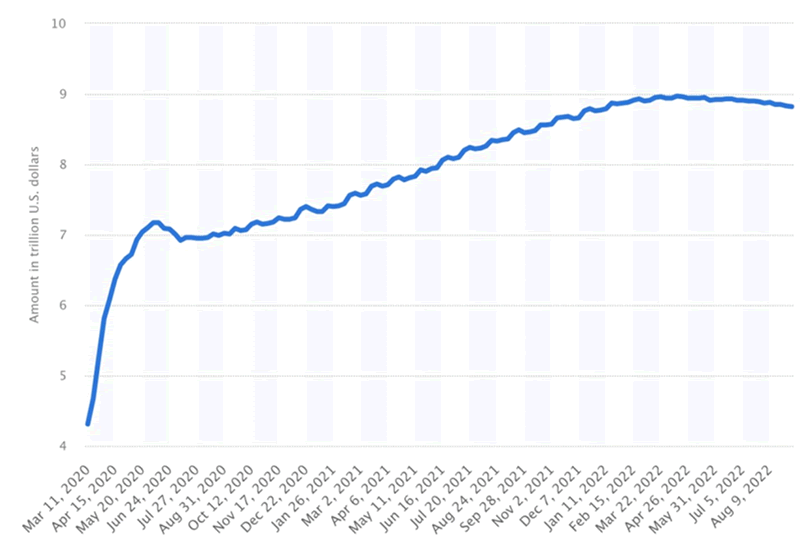
From 2008, when the Fed balance sheet was just $1 trillion, four rounds of quantitative easing raised it to over $8 trillion.
The Treasury and the central bank were forced to adopt QE again in 2020, with the sudden onset of the coronavirus crisis. Money-printing resumed in earnest and interest rates were slashed to 0%. While the Fed’s balance sheet had been “wound down” (it sold bonds to get them off its balance sheet) to about $4 trillion in early 2020, according to Statista, between March 2020 and September 2022, QE more than doubled the balance sheet to $8.8T, as of Sept. 6.
Remember, gold hit an all-time high of $2,034/oz in August 2020. That’s no coincidence.
From the start of pandemic-related government spending in the spring of 2020, to today, the US government has printed over $6 trillion. During that period, the US money supply increased by 41%, with the Fed’s actions amounting to the biggest monetary explosion that has occurred in the 227 years since the founding of the United States. Read more
Why is that important? Because money supply growth and inflation are inexorably linked.
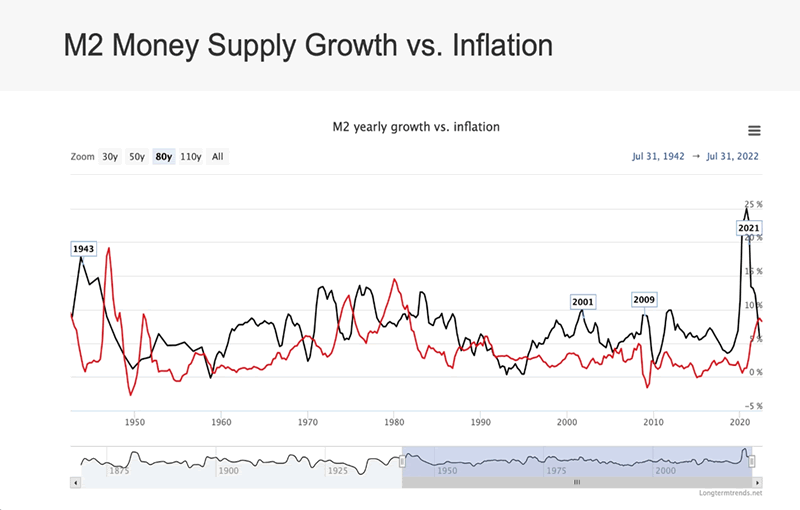
The chart above compares the M2 money supply, which is a measure of the amount of currency in circulation, to the inflation rate, going back to 1950. Historically, M2 has grown with the economy, reaching peaks in 2001, 2009 and 2021, years when the US central bank employed an expansionary monetary policy, including large-scale asset purchases, i.e. QE.
Conclusion
Some investors that are buying US Treasuries, and maintaining their faith in the US dollar, believe that a recession, if it comes at all, is a ways off. At AOTH we strongly disagree. We believe it will arrive quite soon. This is evidenced not only be the actions of a “hostile” Fed, but the inverted yield curve, a reliable recession indicator.
The Fed seems bound and determined to bash the economy over the head with higher interest rates, driving it into recession the same way Paul Volcker’s Fed did in the early 1980s. To really make interest rate increases effective, the Fed would have to raise rates to around 7.5%, from the current 2.5%, to fight inflation that is running at 8.3%. If the Fed were to do that, it would cost an estimated 6 million jobs!
In our last article we used the analogy of the Fed flying a plane — the economy — into a “coffin corner” with rising interest rates that could end up crashing the economy.
Right now the Fed is aggressively raising rates and that’s good for the dollar and bad for gold. The dollar (and Treasuries) is the only game in town but that could change in a hurry if the Fed fails to execute a “soft landing” for the economy and instead the plane lurches into a hard landing, or worse, a coffin corner which kills all on board (investors).
That is the scenario that would cause the Fed to pivot, from monetary tightening to loosening. There is no doubt in my mind they would be forced to once again reduce interest rates and implement another round of QE, pushing bond investors back to gold.
Personally I’d like to see the Fed realize the error of their ways before crashing the economy, but I’m not optimistic that will happen.
Meanwhile, the yield curve continues to invert.
In a typical healthy market, the yield curve (typically the spread between the US 10-year Treasury note and the 2-year note) shows lower returns on short-term investments and higher yields on long-term investments. This makes sense, as investors earn more interest for tying up their money for longer. The yield curve is said to “invert” when short-term yields are higher than long-term yields.
The yield curve has inverted 28 times since 1900, and in 22 of those times, a recession followed. For the last six recessions, a recession began six to 36 months after the curve inverted.
Right before the recession, the yield curve starts to steepen, because the market anticipates multiple rate cuts, and short-term rates fall faster than longer-term rates. In other words, they expect better market conditions to prevail long-term. “The steeper the curve, the greater the difference in yield, and the more likely an investor is willing to accept that risk. As the curve flattens investors receive less compensation for investing in long-term bonds relative to short-term and are less inclined to do so.” (Forbes Advisor)
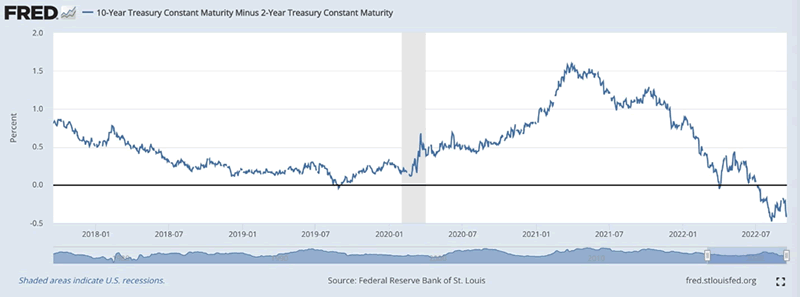
We aren’t there yet, but we notice the yield curve (the difference between the 2-year and the 10-year Treasuries) has been negative since July 8. On average historically, a recession occurs 11 months after the yield curve inverts, meaning we may not be that far away from the Fed pivot that results in a tremendous upswing for gold.
Richard (Rick) Mills
aheadoftheherd.com
subscribe to my free newsletter
Legal Notice / Disclaimer
Ahead of the Herd newsletter, aheadoftheherd.com, hereafter known as AOTH.
Please read the entire Disclaimer carefully before you use this website or read the newsletter. If you do not agree to all the AOTH/Richard Mills Disclaimer, do not access/read this website/newsletter/article, or any of its pages. By reading/using this AOTH/Richard Mills website/newsletter/article, and whether you actually read this Disclaimer, you are deemed to have accepted it.
Any AOTH/Richard Mills document is not, and should not be, construed as an offer to sell or the solicitation of an offer to purchase or subscribe for any investment.
AOTH/Richard Mills has based this document on information obtained from sources he believes to be reliable, but which has not been independently verified.
AOTH/Richard Mills makes no guarantee, representation or warranty and accepts no responsibility or liability as to its accuracy or completeness.
Expressions of opinion are those of AOTH/Richard Mills only and are subject to change without notice.
AOTH/Richard Mills assumes no warranty, liability or guarantee for the current relevance, correctness or completeness of any information provided within this Report and will not be held liable for the consequence of reliance upon any opinion or statement contained herein or any omission.
Furthermore, AOTH/Richard Mills assumes no liability for any direct or indirect loss or damage for lost profit, which you may incur as a result of the use and existence of the information provided within this AOTH/Richard Mills Report.
You agree that by reading AOTH/Richard Mills articles, you are acting at your OWN RISK. In no event should AOTH/Richard Mills liable for any direct or indirect trading losses caused by any information contained in AOTH/Richard Mills articles. Information in AOTH/Richard Mills articles is not an offer to sell or a solicitation of an offer to buy any security. AOTH/Richard Mills is not suggesting the transacting of any financial instruments.
Our publications are not a recommendation to buy or sell a security – no information posted on this site is to be considered investment advice or a recommendation to do anything involving finance or money aside from performing your own due diligence and consulting with your personal registered broker/financial advisor.
AOTH/Richard Mills recommends that before investing in any securities, you consult with a professional financial planner or advisor, and that you should conduct a complete and independent investigation before investing in any security after prudent consideration of all pertinent risks. Ahead of the Herd is not a registered broker, dealer, analyst, or advisor. We hold no investment licenses and may not sell, offer to sell, or offer to buy any security.
If you're interested in learning more about the junior resource and bio-med sectors please come and visit us at www.aheadoftheherd.com Site membership is free. No credit card or personal information is asked for.
Richard is host of Aheadoftheherd.com and invests in the junior resource sector. His articles have been published on over 400 websites, including: Wall Street Journal, Market Oracle, USAToday, National Post, Stockhouse, Lewrockwell, Pinnacledigest, Uranium Miner, Beforeitsnews, SeekingAlpha, MontrealGazette, Casey Research, 24hgold, Vancouver Sun, CBSnews, SilverBearCafe, Infomine, Huffington Post, Mineweb, 321Gold, Kitco, Gold-Eagle, The Gold/Energy Reports, Calgary Herald, Resource Investor, Mining.com, Forbes, FNArena, Uraniumseek, Financial Sense, Goldseek, Dallasnews, Vantagewire, Resourceclips and the Association of Mining Analysts.
Copyright © 2022 Richard (Rick) Mills - All Rights Reserved
Legal Notice / Disclaimer: This document is not and should not be construed as an offer to sell or the solicitation of an offer to purchase or subscribe for any investment. Richard Mills has based this document on information obtained from sources he believes to be reliable but which has not been independently verified; Richard Mills makes no guarantee, representation or warranty and accepts no responsibility or liability as to its accuracy or completeness. Expressions of opinion are those of Richard Mills only and are subject to change without notice. Richard Mills assumes no warranty, liability or guarantee for the current relevance, correctness or completeness of any information provided within this Report and will not be held liable for the consequence of reliance upon any opinion or statement contained herein or any omission. Furthermore, I, Richard Mills, assume no liability for any direct or indirect loss or damage or, in particular, for lost profit, which you may incur as a result of the use and existence of the information provided within this Report.
© 2005-2022 http://www.MarketOracle.co.uk - The Market Oracle is a FREE Daily Financial Markets Analysis & Forecasting online publication.