


The Fed’s Hawkish Bite Left Its Mark on the S&P 500 Stocks
Stock-Markets / Stock Market 2022 Jun 23, 2022 - 07:28 PM GMTBy: P_Radomski_CFA

By raising interest rates, the Fed poured cold water on the red-hot markets and finally chilled investors' enthusiasm. What's next for asset prices?
Work in Progress
With the Fed’s hawkish hammer pounding the financial markets, the selling pressure coincided with events unseen since 2008. Moreover, with the work in progress to reduce inflation poised to push asset prices even lower, I’ve long warned that we’re likely far from a medium-term bottom. For example, I wrote on May 31:
With recession fears decelerating and optimism returning to Wall Street, the bulls are brimming with confidence.
Please see below:
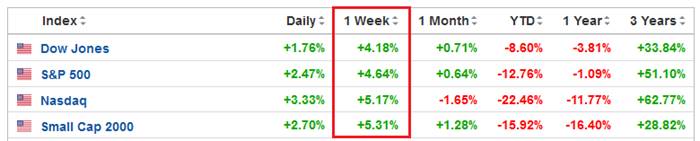
Source: Investing.com
(…) [However], while U.S. stock indices rallied sharply last week, guess what else participated in the festivities?
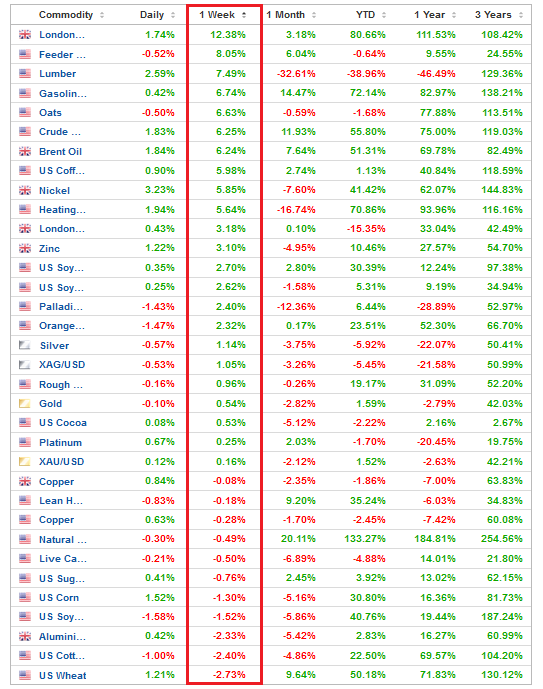
Source: Investing.com
To explain, the table above tallies the performance of commodities over various time periods. If you analyze the vertical red rectangle, notice how most commodities rallied alongside equities. As a result, the thesis was on full display.
When economic optimism elicits rallies on Wall Street, that same optimism uplifts commodities. Therefore, if the Fed tries to appease investors and passively attack inflation, it will only spur more inflation.
As such, the idea of a “positive feedback loop” where ‘stocks rally, inflation cools [and] Fed tightening expectations abate” is extremely unrealistic. In fact, it’s the exact opposite. The only bullish outcome is if economically-sensitive commodities collapse on their own. Then, input inflation would subside and eventually cool output inflation, and the Fed could turn dovish.
However, the central bank has been awaiting this outcome for two years. Thus, my comments from Apr. 6 remain critical. If investors continue to bid up stock prices, the follow-through from commodities will only intensify the pricing pressures in the coming months. Therefore, investors are flying blind once again.
To that point, the S&P 500 reversed sharply over the last several days, and the S&P Goldman Sachs Commodity Index (S&P GSCI) followed suit.
For context, the S&P GSCI contains 24 commodities from all sectors: six energy products, five industrial metals, eight agricultural products, three livestock products, and two precious metals. However, energy accounts for roughly 54% of the index’s movement.
Please see below:
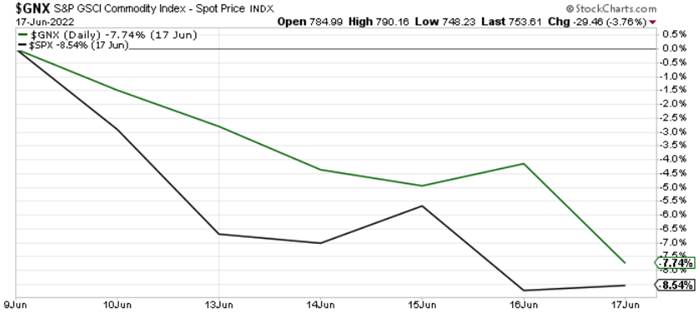
To explain, the green line above tracks the S&P GSCI, while the black line above tracks the S&P 500. As you can see, hawkish rhetoric and a 75 basis point rate hike had their desired effect.
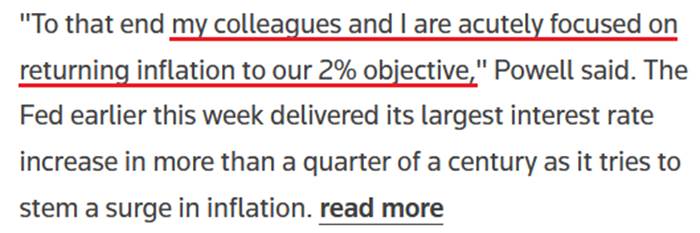
Furthermore, I warned on Apr. 6 that higher asset prices are antithetical to the Fed’s 2% inflation goal. In a nutshell: the more the bull gores, the more inflation bites. I wrote:
Please remember that the Fed needs to slow the U.S. economy to calm inflation, and rising asset prices are mutually exclusive to this goal. Therefore, officials should keep hammering the financial markets until investors finally get the message.
Moreover, with the Fed in inflation-fighting mode and reformed doves warning that the U.S. economy “could teeter” as the drama unfolds, the reality is that there is no easy solution to the Fed’s problem. To calm inflation, it has to kill demand. As that occurs, investors should suffer a severe crisis of confidence.
Speaking of which, the fundamental thesis continues to unfold as expected. For example, Fed Chairman Jerome Powell said on Jun. 17: “The Federal Reserve’s strong commitment to our price stability mandate contributes to the widespread confidence in the dollar as a store of value.” Moreover, “The Fed’s commitment to both our dual mandate and financial stability encourages the international community to hold and use dollars.”
As a result, while I’ve long warned that unanchored inflation would elicit a hawkish response from the Fed and uplift the USD Index, the man at the top remains focused on the task at hand.
Please see below:
Source: Reuters
Likewise, Fed Governor Christopher Waller said on Jun. 18:
“This week, the FOMC took another significant step toward achieving our inflation objective by raising the Federal Funds rate target by 75 basis points. In my view, and I speak only for myself, if the data comes in as I expect I will support a similar-sized move at our July meeting.”
Please see below:
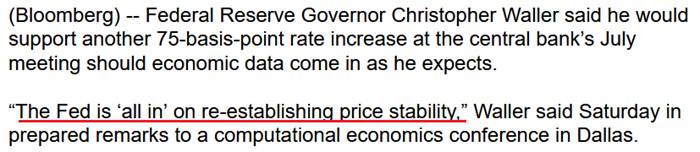
Source: Bloomberg
Thus, while I’ve been warning for months that the Fed isn’t bluffing, investors are suffering the consequences of their short-sighted expectations. For context, I wrote on Dec. 23, 2021:
Please note that when the Fed called inflation “transitory,” I wrote for months that officials were misreading the data. As a result, I don’t have a horse in this race. However, now, they likely have it right. Thus, if investors assume that the Fed won’t tighten, their bets will likely go bust in 2022.
Continuing the theme, Atlanta Fed President Raphael Bostic said on Jun. 17: "We're attacking inflation and we're going to do all that we can to get it back down to a more normal level, which for us has got to be 2%. We'll do whatever it takes to make that happen."
As a result, the more investors bid up stock and commodity prices, the more "muscular" the Fed's policies become.
Please see below:
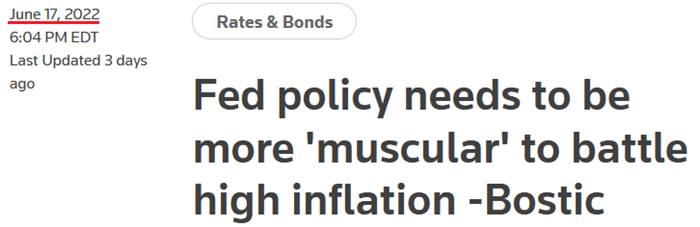
Source: Reuters
Thus, while Fed officials continue to press down on the hawkish accelerator, the plight of many financial assets highlights the ferocity of central bankers’ war against inflation. Moreover, with all bouts of unanchored inflation ending in recessions over the last ~70 years, more fireworks should erupt in the months ahead.
Short Squeeze 2.0
It’s important to remember that financial assets don’t move in a straight line. Therefore, while the fundamental outlook continues to deteriorate, the algorithms may spot bullish short-term trends that let the scalpers profit in the interim. For example, I noted on Jun. 15 that one-sided positioning could (and eventually did) spark a relief rally. I wrote:
The liquidation frenzy (margin calls) that erupted recently coincided with hedge funds going on the largest two-day selling spree on record. If you analyze the chart below, you can see that Goldman Sachs’ prime brokerage data shows the z-score of combined net dollars sold on Jun. 10 and Jun. 13 exceeded the sell-off following the collapse of Lehman Brothers in 2008.
Thus, while it’s far from a sure thing, it’s prudent to note how these variables may impact the short-term price action.
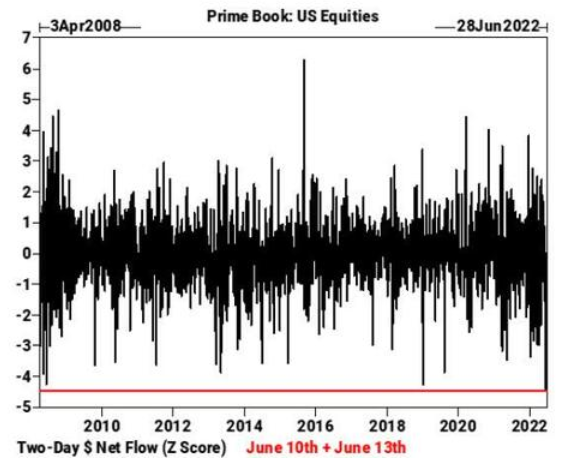
Source: Goldman Sachs
To that point, last week's sell-off has too many market participants on one side of the boat. As a result, don't confuse a short squeeze with bullish price action.
Please see below:
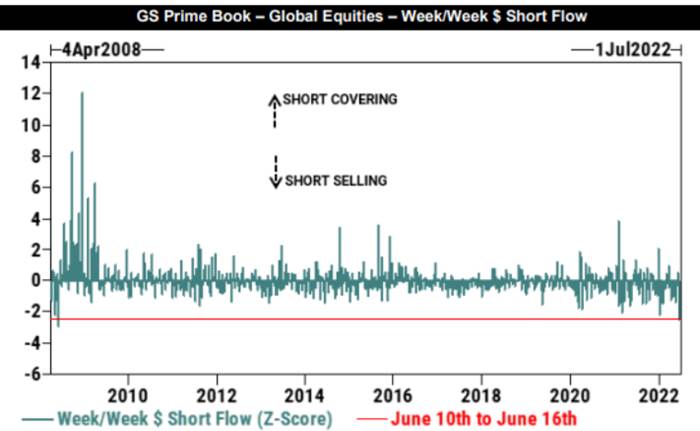
Source: Goldman Sachs
To explain, the blue bars above track the short-selling and short-covering activity of Goldman Sachs' hedge fund clients. If you analyze the red line at the bottom, you can see that the z-score of hedge funds' weekly short sales was the highest since April 2008.
In a nutshell: hedge funds shorted more stocks as the S&P 500 declined, leaving them highly exposed to a short squeeze. As a result, if the markets rally, consider the price action within the context of the above data.
Likewise, oversold conditions are also present.
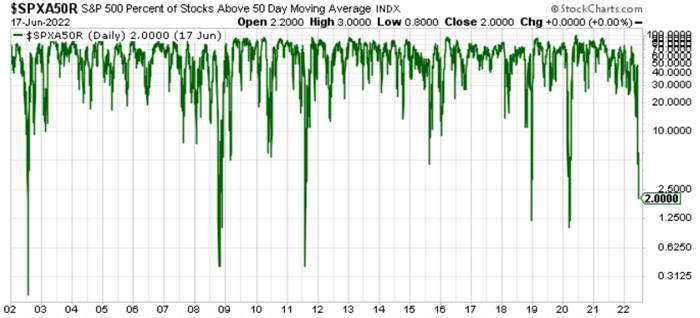
To explain, the green line above tracks the percentage of S&P 500 stocks above their 50-day moving average. If you analyze the right side of the chart, you can see that only 2% of S&P 500 constituents hold the key level, and the reading is abnormally low.
For context, it’s a contrarian indicator, meaning that too much pessimism often elicits a short-term reversion. Moreover, with the dot-com bubble, the global financial crisis (GFC), the 2011 growth scare, the COVID-19 crash, and the 2018 sell-off the only periods with lower readings, it may take a shock-and-awe event to move the metric lower in the short term.
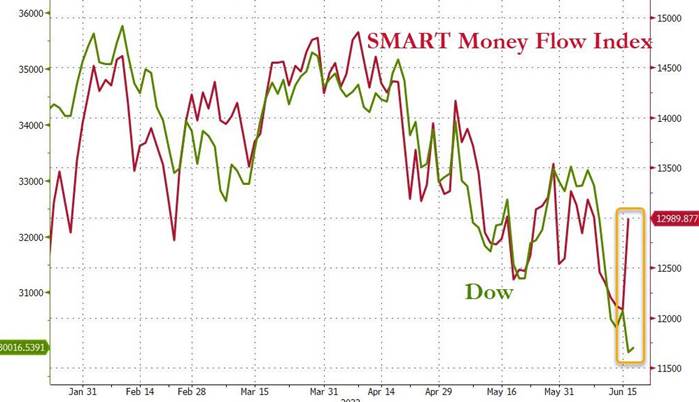
Also noteworthy, Bloomberg’s SMART Money Flow Index diverged from the Dow Jones Industrial Average (DJIA) late last week. For context, the indicator gauges the behavior of ‘smart’ investors that trade during the final hour of the day.
Please see below:
Source: Bloomberg/Zero Hedge
To explain, the green line above tracks the DJIA, while the red line above tracks Bloomberg’s SMART Money Flow Index. If you analyze the right side of the chart, you can see that the smart money expects some selling reprieve.
Finally, Bank of America’s Bull & Bear Indicator is at its lowest possible level. Again, this uses contrarian methodology, emphasizing how bearish over-positioning can spark sentiment shifts.
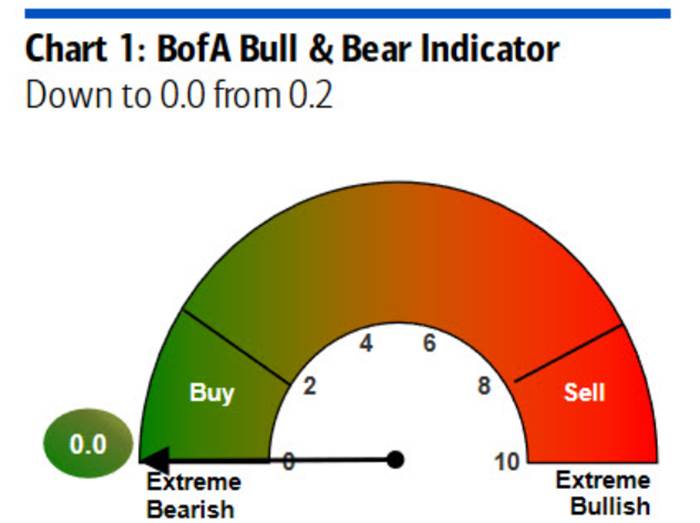
Source: Bank of America
The Bottom Line
There have been several fits and starts along the GDXJ ETF’s path to lower prices, and the medium-term fundamentals remain profoundly bearish. However, rallies can increase investors’ anxiety if they’re unsure of why the optimism has manifested. As a result, while the contrarian bullish stock data may uplift the PMs in the short term, a potential sentiment reversion doesn’t impact their medium-term outlooks.
Moreover, with the Fed hawked up and the developments bullish for the USD Index and U.S. real yields, the S&P 500 and the PMs should confront lower lows in the months ahead.
In conclusion, the PMs declined on Jun. 17, as volatility has asset prices gyrating sharply by the day. However, the frantic buying/selling activity is bearish and highlights the fragility of the financial markets. Therefore, more bouts of panic should erupt in the coming months, even if the selling pressure subsides in the near term.
Thank you for reading our free analysis today. Please note that the above is just a small fraction of today’s all-encompassing Gold & Silver Trading Alert. The latter includes multiple premium details such as the targets for gold and mining stocks that could be reached in the next few weeks. If you’d like to read those premium details, we have good news for you. As soon as you sign up for our free gold newsletter, you’ll get a free 7-day no-obligation trial access to our premium Gold & Silver Trading Alerts. It’s really free – sign up today.
Przemyslaw Radomski, CFA
Founder, Editor-in-chief
Tools for Effective Gold & Silver Investments - SunshineProfits.com
Tools für Effektives Gold- und Silber-Investment - SunshineProfits.DE
* * * * *
About Sunshine Profits
Sunshine Profits enables anyone to forecast market changes with a level of accuracy that was once only available to closed-door institutions. It provides free trial access to its best investment tools (including lists of best gold stocks and best silver stocks), proprietary gold & silver indicators, buy & sell signals, weekly newsletter, and more. Seeing is believing.
Disclaimer
All essays, research and information found above represent analyses and opinions of Przemyslaw Radomski, CFA and Sunshine Profits' associates only. As such, it may prove wrong and be a subject to change without notice. Opinions and analyses were based on data available to authors of respective essays at the time of writing. Although the information provided above is based on careful research and sources that are believed to be accurate, Przemyslaw Radomski, CFA and his associates do not guarantee the accuracy or thoroughness of the data or information reported. The opinions published above are neither an offer nor a recommendation to purchase or sell any securities. Mr. Radomski is not a Registered Securities Advisor. By reading Przemyslaw Radomski's, CFA reports you fully agree that he will not be held responsible or liable for any decisions you make regarding any information provided in these reports. Investing, trading and speculation in any financial markets may involve high risk of loss. Przemyslaw Radomski, CFA, Sunshine Profits' employees and affiliates as well as members of their families may have a short or long position in any securities, including those mentioned in any of the reports or essays, and may make additional purchases and/or sales of those securities without notice.
Przemyslaw Radomski Archive |
© 2005-2022 http://www.MarketOracle.co.uk - The Market Oracle is a FREE Daily Financial Markets Analysis & Forecasting online publication.