Stock Maket Trading Lesson - How to REALLY Trade Markets
InvestorEducation / Learn to Trade Nov 26, 2021 - 04:16 PM GMTBy: Nadeem_Walayat
Stock Market Conclusion
Stock market correction so far has been fairly mild with the tech stocks not reaching levels to offer enough of a discount to justify exposure to in the face of the coming inflation storm. Whilst October is not done with yet i.e. we could yet see a final leg down, especially given the potential for earnings surprises form the tech giants due over the next 10 days.. However with each passing day such an outcome diminishes, thus the stock market appears to be gearing up for another run to new all time highs which given the mild correction so far suggests that the Dow could trade nearer to 40k, than 37k by the end of this year.
However, my outlook for 2022 sees worsening conditions that will see transitory inflation become permanent, so there is going to come a time when investors will do the math of what high inflation means for future corporate earnings, i.e. lower earnings due to rising costs and less disposable incomes. Hence it remains highly probable that most stocks will trade to below their October 2021 lows during 2022.
34th Anniversary of the Greatest Crash in Stock Market History - 1987
It's that time of the year again when the stock market reaches the historic apex of the darkest month for stocks of the year, October the 19th, the 34th anniversary of the 1987 Black Monday stock market crash that few saw coming but ever since many expect to repeat. So regardless of what the stock market has actually done thus far, by this point of the year the perma bears can always be seen literally jumping up and down like demented rabbits proclaiming that a crash is once more imminent as they point to a myriad of harbingers of the stock market apocalypse. So it is no wonder that October tends to be an unusually irrational month for where stock market expectations are concerned. However note that EVERY crash in the general stock market indices such as the Dow, S&P and FTSE have always resolved in the mother of all buying opportunities.
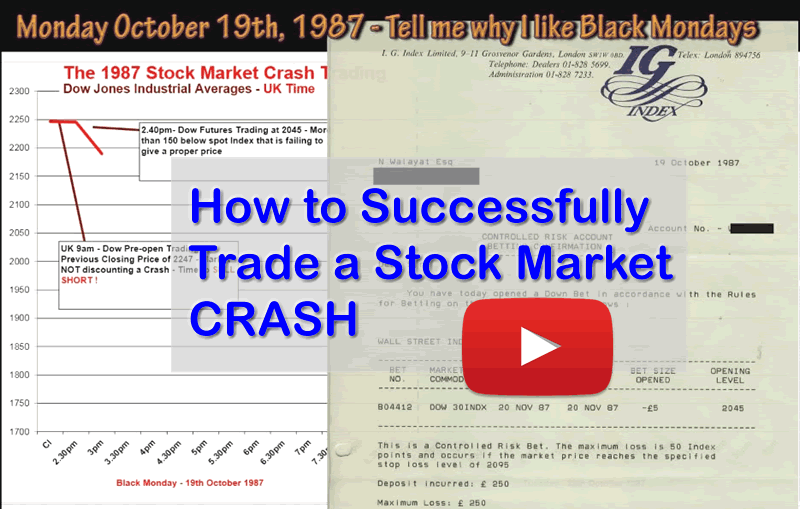
Anyway here's how I successfully traded the 1987 Crash 34 years ago.
Key Lesson - How to REALLY Trade Markets
Reacting to price movements in real time as they approach, retreat and break Support and Resistance levels! That's how one actually successfully trades markets, sounds simple enough but you get out what you put in and what you need to put in is TIME watching the markets moving in real time.
It's what got me short on the Dow BEFORE it crashed in 1987. And it is not as easy as it sounds as it demands commitment in terms of time. To sit there every trading day watching maybe no more than 2 markets move between and through support and resistance levels for only then will one have the price imprinted onto ones neural net (brain), to become synchronised with that market.
Go long when prices break resistance, short when prices break support. counting the buy / sell triggers as one goes along which reinforce the direction of travel. Intra-day trading demands sitting there for a good 6 hours a day watching perhaps just 2 markets move, which I do not have the time for. So when trading my preference is for end of day trading i.e. utilising the daily charts instead of intraday.
One of the first trading books I read put me onto this track "How to Make Profits in Commodities" by WD Gann, tops and bottoms, highs and lows, and multiples thereof and that was basically how I viewed the markets mostly in terms of tops and bottoms, highs and lows. For instance the Dow bottomed at 18,213 in March 2020, the Low forecasts resistance at 150% and 200% at 27,319, and 36,425, and then you have percentages of ranges (1/8ths) and so on.
At that time I remember being skeptical of trend lines, perhaps they worked less well then than now with so many technical traders out there?
Today?
In addition to tops and bottoms I count moving averages as being of next importance and then trend lines.
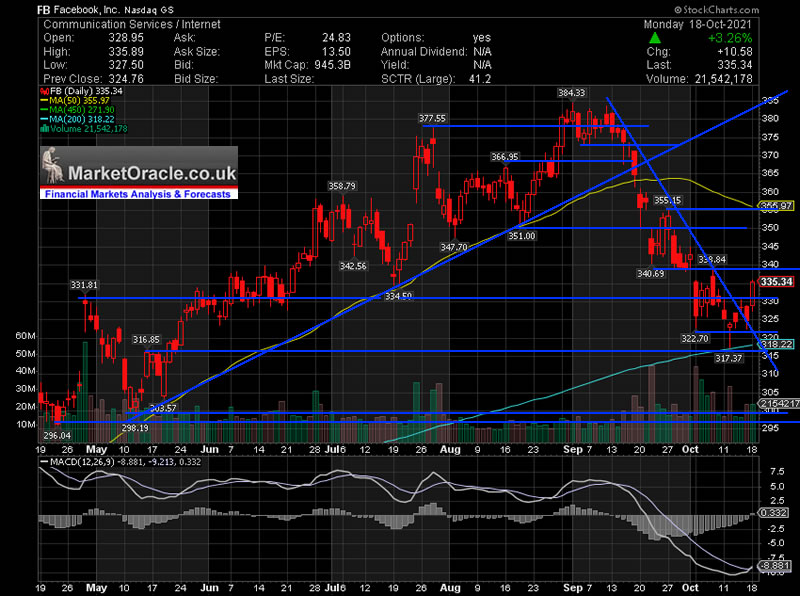
This is what Facebook's trading chart looks like, and no I am not trading Facebook stock, just keeping a close eye on it as I aim to buy more given that it is less over valued than it's FAANG brethren.

The stock bounced from the 200 day moving average and cleared 2 minor resistance levels, that's as far as the trading would take it i.e. 3 minor buy triggers.
This article is an excerpt from my recent extensive analysis of why inflation will be far from transitory, so batton down the hatches for whats to come- - Protect Your Wealth From PERMANENT Transitory Inflation
Contents:
- Best Real Terms Asset Price Growth Countries for the Next 10 Years
- Worst Real Terms Asset Price Growth Countries for the Next 10 Years
- The INFLATION MEGA-TREND
- Ripples of Deflation on an Ocean of Inflation!
- Stock Market Trend Forecast Current State
- US Dollar - Stocks Correlation
- US Dollar vs Yields vs Dow
- Stock Market Conclusion
- 34th Anniversary of the Greatest Crash in Stock Market History - 1987
- Key Lesson - How to REALLY Trade Markets
- AI Stocks Portfolio Current State
- October Investing Plan
- HIGH RISK STOCKS INVEST AND FORGET PORTFOLIO
- Can US Save Taiwan From China?
Also access to my latest extensive analysis - AI Tech Stocks Portfolio Updated Buying Levels and Zones as Financial Crisis 2.0 Continues Brewing
Contents:
Financial Crisis 2.0 Checklist
The China Syndrome
Stock Market Begins it's Year End Seasonal Santa Rally
Stock Market Trend Forecast Current State
INVESTING LESSON - BUYING VALUE
Peloton 35% CRASH a Lesson of What Happens When One Over Pays for a Loss Making Growth Stock
INVESTING LESSON - Give your Portfolio Some Breathing Space
INVESTING LESSON - Give your Portfolio Some Breathing Space
How Stagflation Effects Stocks
INTEL Bargain - 15.5% Discount Sale
Why Intel stock price dropped 15%?
FACEBOOK - 10% DIscount
IBM - 20% Discount
Amazon - 5% Discount
APPLE 4% Discount
AMD $136 on Route to $200
TSMC - $117
Microsoft $336
Google $2980, PE 28.7, EC 30.
Nvidia Leaves planet Earth - $299, PE of 106
Heads Up on NEW Potential Tech Stocks
AI Stocks Portfolio Updated Buying Levels
AI Stocks Buying Plan B
FREE TRADE the Perfect Stocks and Shares ISA?
FREE SHARE FROM FREETRADE
High Risk Stocks Brief
Crypto's 20% Discount Event
Bitcoin Trend
Palladium Brief
The whole of which was first been made available to Patrons who support my work. So for immediate first access to ALL of my analysis and trend forecasts then do consider becoming a Patron by supporting my work for just $4 per month. https://www.patreon.com/Nadeem_Walayat.
Also access to my recent analysis that maps out what I expect to happen during the next big crypto bull market is only just beginning for most crypto's
Bitcoin NEW All time High is TRIGGER for Future Alt Coins Price Explosion
Contents:
- Bitcoin & Ethereum 2021 Trend
- Crypto Portfolio Current State
- The BITCOIN NEW ALL TIME HIGH Changes EVERYTHING!
- Ravencoin to the MOON!
- What am I doing?
- How to Invest in Crypto's
- Bitcoin 2022 Price Target
- Ethereum 2022 Price Target
- Ravencoin 2022 Price Target
- Cardano (ADA) 2022 Price Target
- Chainlink 2022 Price Target
- Pokadot 2022 Price Target
- Solano 2022 Price Target
- Litecoin 2022 Price Target
- Arweave 2022 Price Target
- Stellar Lumens - XLM 2022 Price Target
- Eth Classic 2022 Price Target
- Vechain 2022 Price Target
- EOS 2022 Price Target
- Earnings Noise Delivers INTEL And IBM Buy Opps
- Facebook and Google Could CRASH 10% Post Earnings Day
- High Risk Stocks Swings and Roundabouts
For crypto trading and investing see Binance for 10% discount on trading fees - Discount Code LZ728VLZ
For managing your crypto's see Coinbase
For GPU mining check out Nicehash (affiliate links).
And access to why inflation will be far from transitory, batten down the hatches for what's to come-
And my extensive analysis of Silver concluding in a trend forecast into Mid 2022.
Silver Price Trend Forecast October 2021 to May 2022, CHINOBLE! AI Stocks Buying Plan
- UK Inflation Soaring into the Stratosphere, Real rate Probably 20% Per Annum
- The 2% Inflation SCAM, Millions of Workers take the Red Pill
- Silver Previous Forecast Recap
- Gold Price Trend Implications for Silver
- Silver Supply and Demand
- Silver vs US Dollar
- Gold / Silver Ratio
- SILVER Trend Analysis
- Long-term Trend Analysis
- Formulating a Trend Forecast
- Silver Price Trend Forecast October 2021 to May 2022
- Silver Investing Strategy
- SIL ETF - What About Silver Mining Stocks?
- Gold Price Trend Brief
- Why the CCP is Living on Borrowed Time and Needs a War
- Understanding the Chinese Regime and What it is Capable Of
- Guanxi
- Chinese People do NOT Eat Dogs Newspeak
- CHINOBLE! Evergrande Reality Exposes China Fiction!
- AI Stocks Portfolio Investing Strategy
- AI Stocks Portfolio Amendments
- AI Stocks Portfolio Current State
- October Investing Plan
- HIGH RISK STOCKS INVEST AND FORGET PORTFOLIO
- Why China Could Crash Bitcoin / Crypto's!
- My Next Analysis
So for immediate first access to ALL of my analysis and trend forecasts then do consider becoming a Patron by supporting my work for just $4 per month. https://www.patreon.com/Nadeem_Walayat.
My analysis schedule includes:
- UK House Prices Trend Analysis, including an update for the US and a quick look at Canada and China - 65% done
- How to Get Rich! - 90% done - This is a good 6 month work in progress nearing completion.
- US Dollar and British Pound analysis
- Gold Price Trend Analysis - 10%
Again for immediate access to all my work do consider becoming a Patron by supporting my work for just $4 per month. https://www.patreon.com/Nadeem_Walayat.
And ensure you are subscribed to my ALWAYS FREE newsletter for my next in-depth analysis.
Your AI data preprocessing analyst.
Nadeem Walayat
Copyright © 2005-2021 Marketoracle.co.uk (Market Oracle Ltd). All rights reserved.
Nadeem Walayat has over 35 years experience of trading derivatives, portfolio management and analysing the financial markets, including one of few who both anticipated and Beat the 1987 Crash. Nadeem's forward looking analysis focuses on UK inflation, economy, interest rates and housing market. He is the author of five ebook's in the The Inflation Mega-Trend and Stocks Stealth Bull Market series that can be downloaded for Free.
 Nadeem is the Editor of The Market Oracle, a FREE Daily Financial Markets Analysis & Forecasting online publication that presents in-depth analysis from over 1000 experienced analysts on a range of views of the probable direction of the financial markets, thus enabling our readers to arrive at an informed opinion on future market direction. http://www.marketoracle.co.uk
Disclaimer: The above is a matter of opinion provided for general information purposes only and is not intended as investment advice. Information and analysis above are derived from sources and utilising methods believed to be reliable, but we cannot accept responsibility for any trading losses you may incur as a result of this analysis. Individuals should consult with their personal financial advisors before engaging in any trading activities.
Nadeem Walayat Archive |
© 2005-2022 http://www.MarketOracle.co.uk - The Market Oracle is a FREE Daily Financial Markets Analysis & Forecasting online publication.


