Protect Your Wealth From PERMANENT Transitory Inflation
Economics / Inflation Nov 19, 2021 - 02:44 PM GMTBy: Nadeem_Walayat
In this analysis I explain why 'Transitory' Inflation is about to become permanent and some pointers of what one should do to protect ones wealth from the stealth inflation theft of purchasing power. This analysis formed part of my in-depth housing market analysis in progress which has mushroomed beyond my original planned trend forecast for UK house prices which now encompasses an analysis of the state of play of most of world!. So in the interests's of timeliness my stocks analysis is being posted separately ahead of my housing market analysis as will be the case for future analysis form now on.
This is part 1 of 2 of my recent extensive analysis:
Protect Your Wealth From PERMANENT Transitory Inflation
- Best Real Terms Asset Price Growth Countries for the Next 10 Years
- Worst Real Terms Asset Price Growth Countries for the Next 10 Years
- The INFLATION MEGA-TREND
- Ripples of Deflation on an Ocean of Inflation!
- Stock Market Trend Forecast Current State
- US Dollar - Stocks Correlation
- US Dollar vs Yields vs Dow
- Stock Market Conclusion
- 34th Anniversary of the Greatest Crash in Stock Market History - 1987
- Key Lesson - How to REALLY Trade Markets
- AI Stocks Portfolio Current State
- October Investing Plan
- HIGH RISK STOCKS INVEST AND FORGET PORTFOLIO
- Can US Save Taiwan From China?
The whole of which was first made available to Patrons who support my work. So for immediate first access to ALL of my analysis and trend forecasts then do consider becoming a Patron by supporting my work for just $4 per month. https://www.patreon.com/Nadeem_Walayat.
With my NEXT timely analysis due Monday morning (21st Nov) focused on capitalising on the METAVERSE!
Whilst my most recent analysis updates AI stocks buying levels and zones in the wake of recent earnings reports and the current state of the brewing Financial Crisis 2.0
AI Tech Stocks Portfolio Updated Buying Levels and Zones as Financial Crisis 2.0 Continues Brewing
Contents:
Financial Crisis 2.0 Checklist
The China Syndrome
Stock Market Begins it's Year End Seasonal Santa Rally
Stock Market Trend Forecast Current State
INVESTING LESSON - BUYING VALUE
Peloton 35% CRASH a Lesson of What Happens When One Over Pays for a Loss Making Growth Stock
INVESTING LESSON - Give your Portfolio Some Breathing Space
INVESTING LESSON - Give your Portfolio Some Breathing Space
How Stagflation Effects Stocks
INTEL Bargain - 15.5% Discount Sale
Why Intel stock price dropped 15%?
FACEBOOK - 10% DIscount
IBM - 20% Discount
Amazon - 5% Discount
APPLE 4% Discount
AMD $136 on Route to $200
TSMC - $117
Microsoft $336
Google $2980, PE 28.7, EC 30.
Nvidia Leaves planet Earth - $299, PE of 106
Heads Up on NEW Potential Tech Stocks
AI Stocks Portfolio Updated Buying Levels
AI Stocks Buying Plan B
FREE TRADE the Perfect Stocks and Shares ISA?
FREE SHARE FROM FREETRADE
High Risk Stocks Brief
Crypto's 20% Discount Event
Bitcoin Trend
Palladium Brief
Also gain access to my recent highly timely analysis on why it is time to get onboard the crypto gravy train heading for millennial FOMO 2022 - Bitcoin NEW All time High is TRIGGER for Future Alt Coins Price Explosion
Contents:
- Bitcoin & Ethereum 2021 Trend
- Crypto Portfolio Current State
- The BITCOIN NEW ALL TIME HIGH Changes EVERYTHING!
- Ravencoin to the MOON!
- What am I doing?
- How to Invest in Crypto's
- Bitcoin 2022 Price Target
- Ethereum 2022 Price Target
- Ravencoin 2022 Price Target
- Cardano (ADA) 2022 Price Target
- Chainlink 2022 Price Target
- Pokadot 2022 Price Target
- Solano 2022 Price Target
- Litecoin 2022 Price Target
- Arweave 2022 Price Target
- Stellar Lumens - XLM 2022 Price Target
- Eth Classic 2022 Price Target
- Vechain 2022 Price Target
- EOS 2022 Price Target
- Earnings Noise Delivers INTEL And IBM Buy Opps
- Facebook and Google Could CRASH 10% Post Earnings Day
- High Risk Stocks Swings and Roundabouts
For trading crypto's at probably the worlds safest exchange see Coinbase (affiliate links).
For one of the best crypto trading platforms see Binance for 10% discount on trading fees - Discount Code LZ728VLZ
For mining with your GPU check out Nicehash.
As well as access to why inflation will be far from transitory, batten down the hatches for what's to come-
And my extensive analysis of Silver concluding in a trend forecast into Mid 2022.
Silver Price Trend Forecast October 2021 to May 2022, CHINOBLE! AI Stocks Buying Plan
- UK Inflation Soaring into the Stratosphere, Real rate Probably 20% Per Annum
- The 2% Inflation SCAM, Millions of Workers take the Red Pill
- Silver Previous Forecast Recap
- Gold Price Trend Implications for Silver
- Silver Supply and Demand
- Silver vs US Dollar
- Gold / Silver Ratio
- SILVER Trend Analysis
- Long-term Trend Analysis
- Formulating a Trend Forecast
- Silver Price Trend Forecast October 2021 to May 2022
- Silver Investing Strategy
- SIL ETF - What About Silver Mining Stocks?
- Gold Price Trend Brief
- Why the CCP is Living on Borrowed Time and Needs a War
- Understanding the Chinese Regime and What it is Capable Of
- Guanxi
- Chinese People do NOT Eat Dogs Newspeak
- CHINOBLE! Evergrande Reality Exposes China Fiction!
- AI Stocks Portfolio Investing Strategy
- AI Stocks Portfolio Amendments
- AI Stocks Portfolio Current State
- October Investing Plan
- HIGH RISK STOCKS INVEST AND FORGET PORTFOLIO
- Why China Could Crash Bitcoin / Crypto's!
- My Next Analysis
So for immediate first access to ALL of my analysis and trend forecasts then do consider becoming a Patron by supporting my work for just $4 per month,https://www.patreon.com/Nadeem_Walayat.
Note: The information provided in this article is solely to enable you to make your own investment decisions and does not constitute a personal investment recommendation or personalised advice.
Firstly a brief excerpt from my forthcoming housing markets analysis -
Best Real Terms Asset Price Growth Countries for the Next 10 Years
However, the above is looking in the rear view mirror, what one wants to see is what is likely to happen over the next 10 and years, so after much number crunching here are my tables as a rough guide for which are the best nations in terms of relative strength of asset prices in real terms i.e. housing and stocks and which are the worst over the next 10 and 20 years based on the ageing population metric. However, a single metric even though a very important one is just not enough so I have also included a nations climate change risk profile that is expected to increasingly impact on GDP as well as GDP per capita where the lower the GDP the greater the potential for real terms growth i.e. it is much easier for Nigeria to double the size of their economy per capita than Malaysia. Whilst nations with very low GDP Per capita such as Afghanistan have a huge mountain to climb before they become stable enough for sustained growth spurts.
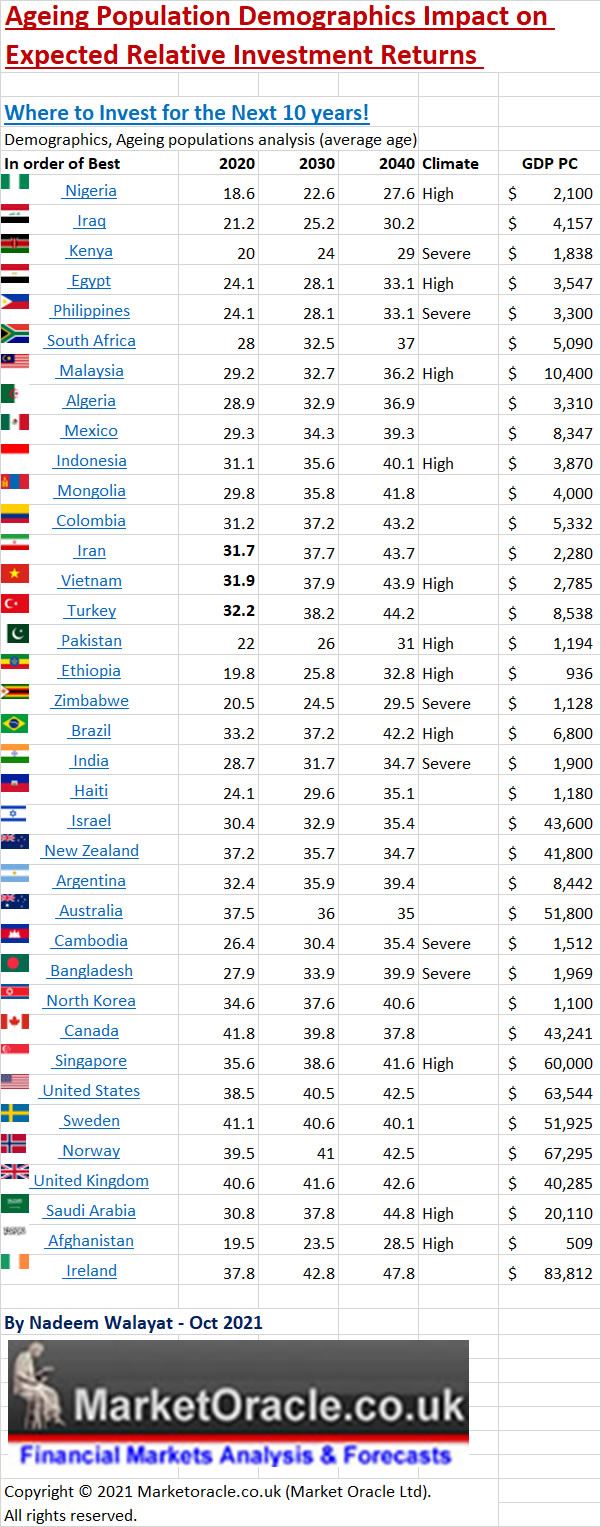
So the best nations to invest in for the next 10 years based on demographics also carry an elevated climate change risk. Thus it is best to pursue those most likely to be politically stable so as to allow GDP to grow i.e. the likes of Nigeria, Pakistan, Egypt, South Africa, Malaysia, Israel, Algeria, Mexico, Indonesia and then the first western nation on the list New Zealand, not far behind is Australia where both actually see their average age FALL due to continuing immigration. The right wings of those nations will never admit to it that their over performance over the next 10 years and likely for the past few decades is primarily due to immigration reversing the ageing process for those nations.
Whilst Canada, US and the UK are closely clustered with their bacon again being saved by HIGH IMMIGRATION! Especially the UK which would be on its way to becoming Germany 2.0 without the industrial heartland. Whilst Canada as is the case with New Zealand and Australia reaps the rewards of a falling average age. Though western european nations have it in their means to increase immigration i.e. it would not take much for the likes of France to join the UK and the US.
Worst Real Terms Asset Price Growth Countries for the Next 10 Years
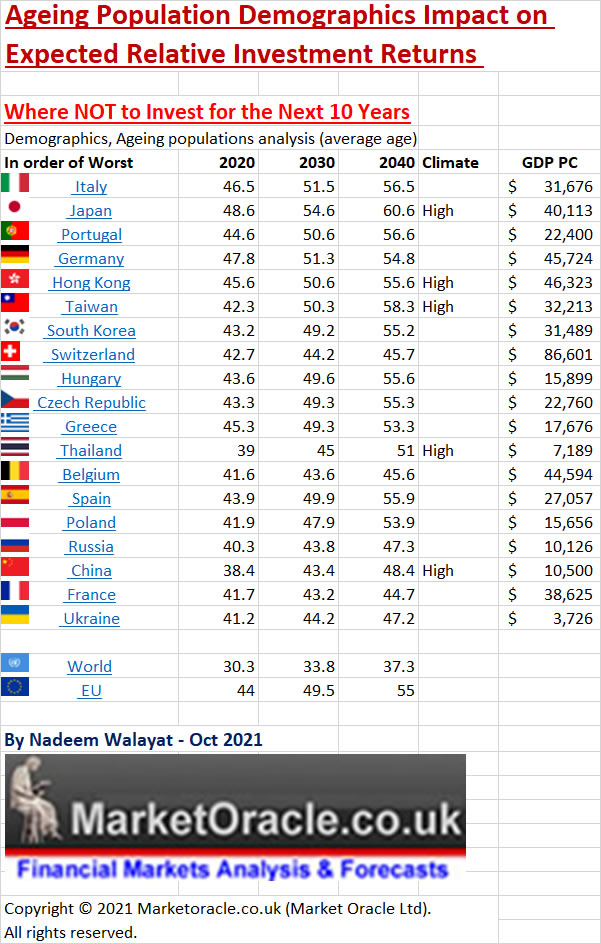
Japan and most of Europe tops the charts. Surprisingly Taiwan and South Korea have ticking demographic time bombs worse than that of China, which means to adjust ones exposure else to wake up one morning to find one is invested in the next Japan. So on this metric one should seek to reduce exposure to those corporations that derive their earnings from those nations, or are subject to heavy taxation as on average are likely to under perform, definitely Japan, and it remains to be seen how much more of Syria Germany is willing to import to effectively become like the UK in immigration terms.
Best Real Terms Asset Price Growth Countries for the Next 20 Years
Full analysis ETA this weekend.....
The INFLATION MEGA-TREND
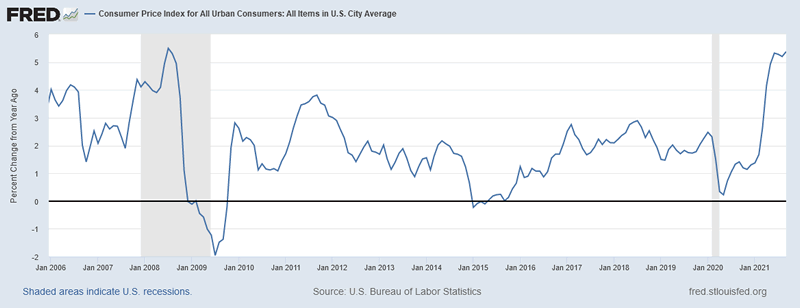
So called transitory US inflation surged to 5.4% for September remaining sticky at above 5% with little signs of moderation and thus likely to prompt the Fed to taper in the near future to signal intentions to bring inflation down to 2% in 2 years time as their 'transitory' propaganda smoke screen is wearing thin. Of course real US inflation in is at least double official fake CPI. Whilst the real rate of inflation in the UK is even worse, likely 3 to 4 times official CPI i.e. about 15% to 20%.
Ripples of Deflation on an Ocean of Inflation!
Though don't worry folks if the clowns in the mainstream press are to be believed deflation is always just around the corner! THIS is what official inflation actually looks like, there is no temporary, there is no transitory, there is only the EXPONENTIAL INFLATION MEGA-TREND courtesy of government / central bank money printing! Which is why we have to take risks with out hard earned capital by contemplating investing in garbage such as Amazon trading at near 60X earnings!
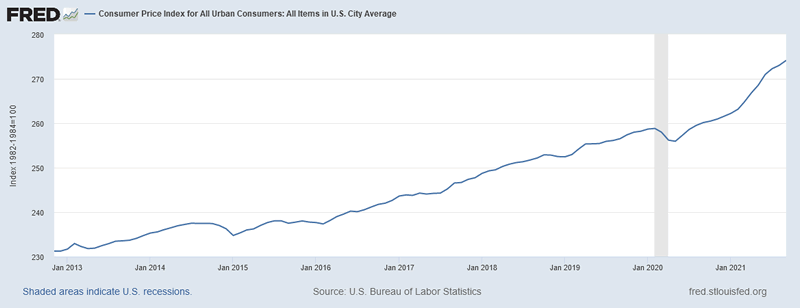
All whilst the mainstream press have got their knickers in a twist on soaring energy prices, always remember folks the real cause of inflation is rampant government and central bank money printing. The government prints bonds and the central bank well just prints money. THAT'S WHAT CAUSES INFLATION! And as the US deficit and fed balance sheet illustrate the anoint of money printing going on is on an epic scale! Which is why I have been warning since at least March 2020 to expect highly inflationary consequences to the pandemic induced rampant money printing.
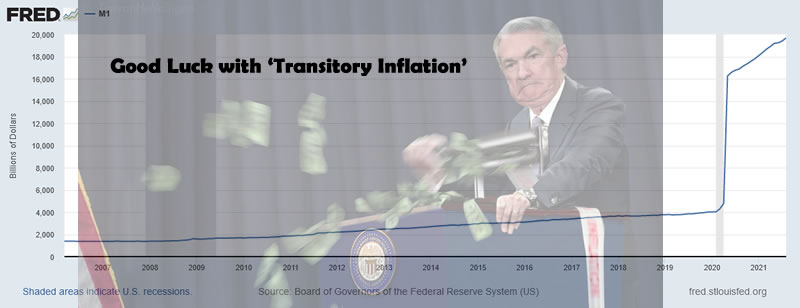
The Inflation stealth tax is EATING away at the value of our cash, savings and bond investments, thus we have no choice but to deploy funds into risky more inflation proof assets even though they may suffer as a consequence of central bank incompetence.
Energy Inflation Canary on the Coal mine - The UK and much of Europe is experiencing the full force of inflation in the energy sector with energy prices rocketing higher even before winter has arrived, that has many energy firms walking away from their fixed rate customers, dumping them onto the regulator to pass onto other energy firms on much higher tariffs.
As an example how much inflation is in the pipeline for UK households, my own Natural Gas is fixed with ZOG Energy at 2.5p per unit until the end of April 2022. The current quote for a similar fix is 6.8p per unit, that is 2.7X, so no wonder many energy firms are doing fake closedown's to reopen later under a different name rather than honour energy contracts with their customers.
These high energy prices will feed through right across the economy, and push up consumer prices much higher than most are expecting. And what is happening now in Europe will soon to taking place in the United States. This is the natural consequences of what happens when governments go on a money printing rampage! PRICES RISE!
Protect yourselves by capitalising on ways to profit from heating ones home!
How? crypto mining with an RTX class GPU where one gets paid for mining whilst pumping out 200watts of extra heat per GPU. Unfortunately the prices of GPU's never fell, so currently I only have 2 desktops earning and heating rather than my planned 6, maybe for next winter I will have compact miners earning and heating every room. Anyway if you have RTX class GPU's in your systems then do investigate mining in the background with the likes of Nicehash that roughly translates into a profit of about $150 per month (after electric costs) using an RTX 3080 GPU as I covered 6 months ago.
HOUSING is leveraged to inflation and is a great long-term inflation hedge, BUT understand that it is an illiquid investment i.e. ones gains are locked in whilst one incurs inflationary costs in terms of maintenance and property taxes, which is why I am not so keen on accumulating a string of properties as it can become a full time job looking after them.
STOCKS can be leveraged to inflation i.e. revenues increase in line with consumer prices though in a climate of rising interest rates the consumers of such products such as iphones have less disposal income to spend on said products and services, thus the best corporations to invest in are either those that the consumers cannot do without such as utilities and the energy sector, or the the basically free to the consumer services such as Google and Facebook which earn the bulk of their revenues from advertising. Though don't take this a signal to start piling into tech stocks because they are OVER VALUED. A P/E of over 30 going into an inflationary period is NOT going to result in higher stock prices. For instance today CPI is 5.4%, in a few months it may be 6% or even 7%, that is going to put a squeeze on earning multiples, pulling them to below 20, even for the likes of Amazon, Microsoft, Apple and Google, one needs to be prepared to see ones tech stocks trade at multiples of under 20!
Luckily our recent binge into small cap high risk Pharma stocks gives us some protection from inflation, especially for those stocks trading on PE's below 20.
Additionally major super market chains should benefit from inflation, the likes of Tesco, Costco and Wall mart given economies of scale, own transport networks and pricing power with the ability to absorb some of the price rises in exchange for higher market share.
Gold and Silver - Should do well during inflation. However rising interest rates act as a drag on precious metals as they do not pay interest so cannot compete. Personally precious metals are not on my radar to gain further exposure to.
Commodities bull runs are already well under way, leading precious metals higher.
Crypto's - Inflation rises and what does Bitcoin do? DOUBLE! Clearly crypto's are the new inflation hedge, FAR MORE SENSITIVE than the older assets such as precious metals. The key positive is that they are the new kids on the block and thus continue to carry an air of mystery of representing the future, and have thus yet to gain widespread popularity. So in terms of percentage returns crypto's should beat most other asset classes over the medium to long-run, BUT are very volatile, NOT for the faint hearted. The thing about crypto's is that just as most people become aware of crypto's and start piling in then that is probably the time they are about to see their value crash by half!
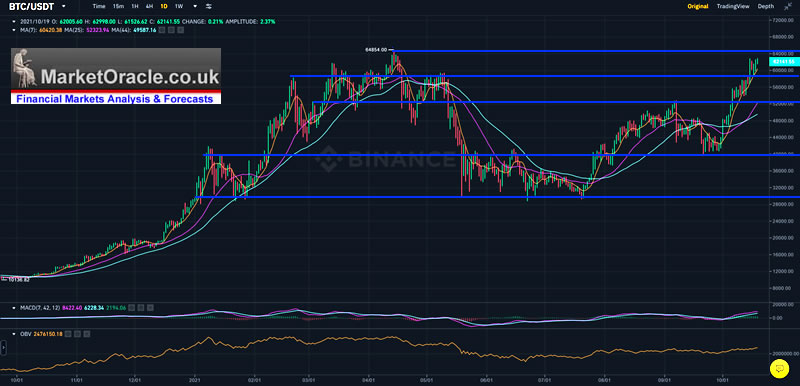
So the key strategy here is to buy crypto's AFTER a collapse, and not during the run up to a peak. Many crypto bugs see the recent run up to BTC $62k as marking the start of the next big bull run, well of course they would, just as every gold bug sees every gold price rally as the start of the run to $10k! Crypto's are volatile, very volatile! But saying that a break above $64k (recent high was $63k) is technically very bullish!
Where, my crypto portfolio is concerned I am raising my buy limits with my focus on the alt coins, such as Ravencoin, Cardano, Pokadot and less so for exposure to Bitcoin and Ethereum. Though note I am no crypto bug i.e. crypto's remain a tiny proportion of my total assets where actual cash invested will be less than 1% total assets, probably more like 0..5%, unlike stocks that can range to as high as 1/3rd of total assets, with housing always the single largest asset class at currently about 42%. Anyway BITC trading above $64k should be taken as a major bullish signal even if BTC corrects afterwards, whilst the Alt coins have a delayed reaction to BTC strength so offer an opportunity of sorts, so I would take such a signal to further raise my buy limits i.,e. raising raven coin limits from $0.05 - 0.08 to 0.07 - 0.1. And as things stand it looks like the only BTC I will likely be accumulating is that which I am mining from 2 GPU's and Eth only if it spikes lower by about 50%.
On a side note what are the consequences of $2 trillion of crypto assets that do not figure into any of the central bank statistics as they largely exist on unregulated decentralised exchanges. Answer - Hidden inflation by means of the wealth effect.
This ties into the effect of asset price inflation since hyper QE began with Covid for why many people may not be going back to work because they have become crypto and stock speculators or rely on speculation for a large part of their earnings thus the economy has far more DEMAND than the central bankers looking at their economic indicators such as Unemployment data realise, and thus the US and other economies rather than slowing down, are in fact over heating due to the hidden wealth effect that crypto's are a small part of. Thus the Fed is trying to engineer a lower unemployment rate may ignite far higher inflation because the economy has shifted it is no longer that which it was in 2019. Thus inflation could go much, much higher whilst the PHD's that populate the central banks cling onto their busted economic models that do not take account of increased profits / earnings from speculation.
WHAT THIS MEANS IS TO EXPECT PERMANENT TRANSITORY INFLATION! The Central banks / academics will fail to understand why inflation is not falling when all their indicators suggest it should. A year ago 5% CPI was unthinkable to most, just as 10% CPI is today, but that is where US CPI could be heading to in 2022, with real inflation twice CPI!
The bottom line is that your crooked central bank and government is STEALING 5.4% (x2) of the purchasing power of your hard earning savings and earnings form every american citizen! And worse for the UK! And that is on the official fake statistics,. We have no choice but to take risks with our capital as the alternative is to a guaranteed total loss! And it may be that the only way to keep pace with central bank real inflation one seriously needs to consider assets that move to the extent that crypto's do. I know many don't want to hear this because they do not want to expose themselves to crypto's given the risks involved such as exchanges disappearing with customer funds etc.. But that is the world that the central bankers have created for us and so one has no choice but to do the work to seek to include crypto's to some extent because that is the only way one can climb the learning curve that crypto's are, never mind NFT's!
Stock Market Trend Forecast Current State
7th Sept 2021 - Stock Market FOMO Hits September Brick Wall - Dow Trend Forecast Sept 2021 to May 2022
Therefore my primary forecast conclusion is for the Dow to target a relatively mild correction into late October 2021 towards 33,500 in advance of the next leg higher for the bull market into early January 2022, towards a new high of at least $37k, and could even have a blow off all the way to 40k! To be followed by my secondary forecast for the Dow to target a correction into Mid February 2021, that should result in another run to all time highs late April / Early May, though this could turn out to be a double top, or even a lower high than the early Jan high, but more on that closer to the conclusion of my primary forecast.
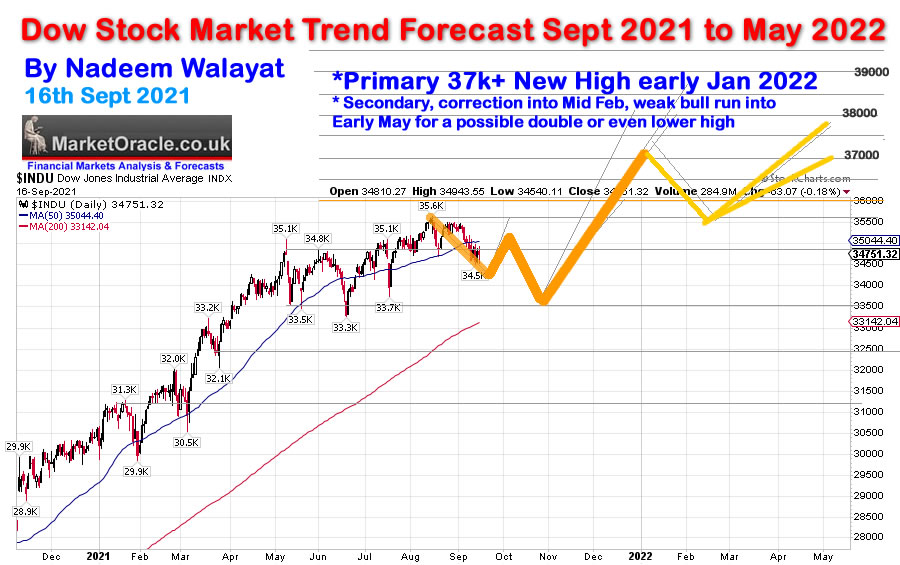
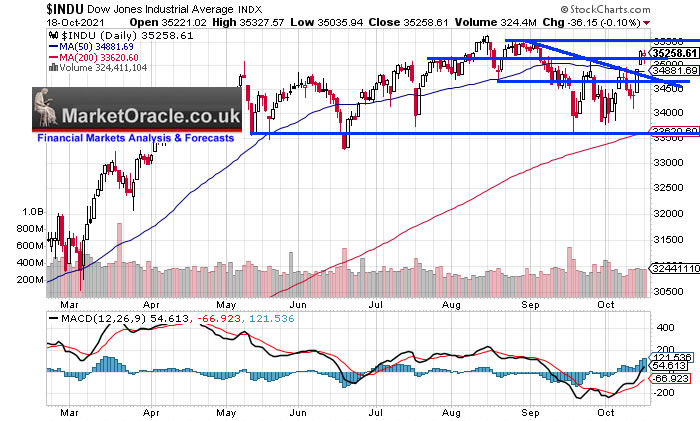
The Dow put in a double bottom and broke above it's most recent high of 35.1k. Which suggests that the correction is over! However, I am skeptical of the rally at this point in time as the bear window still has the remainder of October to run. Though it is tough to expect a lower low under these circumstances. So far the correction has proved disappointing with not much time left to fulfill expectations before the expected strong bull run into the end of the year.
My Strategy
So that we are all reading from the same page, my strategy is to buy some of the AI stocks I de risked from over the summer months at deep discounts to there recent highs as illustrated by my buying levels which remain distant for most stocks, thus I sought a good 15% to 20% drop ahead of a probable rally to new all time highs by the end of this year where I have penciled in the Dow trading into a range of between $37k to $40k. However, I need that discount to buy because it is highly probable that during 2022 stocks will trade BELOW their October lows. So unlike the buy the dip brigade I am looking beyond the price action of the next few months by -
a., Being at least 50% invested in stocks (AI stocks+ High risk stocks + Cash on account = 100%), as in the long-run all crashes, bear markets etc tend to be mere blips on the long-term chart, so the worst thing to do is to be completely out of the market. I am currently about 40% invested, where my objective is to raise that to at around 70% invested but I don't want to pay stupid prices i.e. near 60X earnings for a $2 trillion corps (Amazon).
b. Battening down the hatches for a potentially rough 2022, as the signs of Financial Crisis 2.0 are even stronger today than what prompted me to start de risking during the Summer, where Evergrande is just one of the many canaries in the coal mine, permanent transient inflation, and surging energy prices.
Remember folks ALL of the AI stocks are OVER VALUED! They are NOT DISCOUNTING the potential for ROUGH TIMES ahead i.e. where the central bank is unable to control inflation. As a rough guide, one wants to pay less than a PE of 20 for some protection against an uncertain future which is why Intel is at the top of my buy list. Whilst the likes of Microsoft would need to fall a long way from its lofty PE of 38! Some stocks such as Facebook have corrected near 20% and are tantalising close to where I would buy i.e. around $310.
US Dollar - Stocks Correlation
The the financial blogosphere lately has been making much of the inverse correlation between the Dollar and the Dow where recent signs of dollar strength implies a bearish outlook for stocks.
This chart shows the Dow and inverse USD, so for the correlation to be true both should be moving in the same direction. The long-term pattern suggests there was a strong correlation in trend between stocks and the dollar up until 2011 (Y= Correlated, N=Not correlated). However since then stocks have tended to go up regardless of whether the dollar is strong or not as has been the case since the last inverse high in the dollar, which therefore clearly is just another indicator that the runaway stocks bull market has tended to ignore the fundamentals such as to fall when the dollar trends higher.
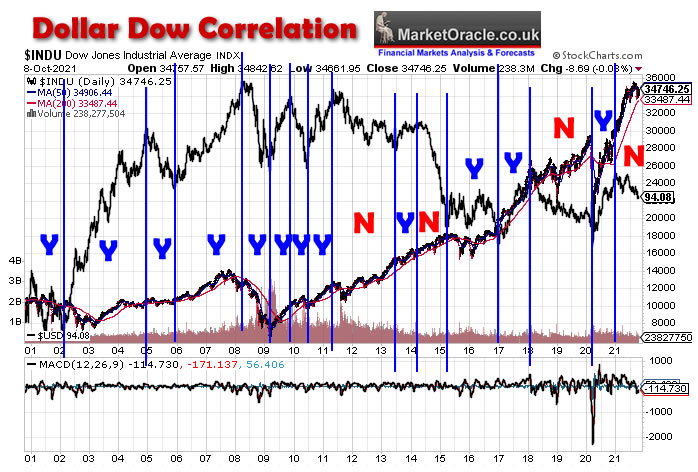
(Charts courtesy of stockcharts.com)
So whilst the most recent stock markets short-term trend off the August mania peaks appears to be responding to the strong dollar as is being reported on in the mainstream press. However as the chart illustrates this could change at anytime with both the dollar and stocks rising (which again would show as an inverse trend on the chart). Thus this could catch many gold fish memory commentators off guard as their rosy picture of a rising dollar and falling stocks fails to materialise.
Thus whilst dollar strength is negative for stocks. However, the stock market has tended to ignore the strong dollar for much of this QE driven bull market. This therefore supports my time frame for an imminent bottom in stocks regardless of what the dollar does. Whilst if the dow / dollar correlation resumes for any significant period of time i.e. for several months than that could be taken as a signal that the bull market is over for the time being at least.
So given my expectations for stock market weakness during 2022, then the Dow / Dollar correlation during 2022 'could' become strong once more.
The rest of this analysis has first been made available to patrons who support my work Protect Your Wealth From PERMANENT Transitory Inflation
- Best Real Terms Asset Price Growth Countries for the Next 10 Years
- Worst Real Terms Asset Price Growth Countries for the Next 10 Years
- The INFLATION MEGA-TREND
- Ripples of Deflation on an Ocean of Inflation!
- Stock Market Trend Forecast Current State
- US Dollar - Stocks Correlation
- US Dollar vs Yields vs Dow
- Stock Market Conclusion
- 34th Anniversary of the Greatest Crash in Stock Market History - 1987
- Key Lesson - How to REALLY Trade Markets
- AI Stocks Portfolio Current State
- October Investing Plan
- HIGH RISK STOCKS INVEST AND FORGET PORTFOLIO
- Can US Save Taiwan From China?
So for immediate first access to ALL of my analysis and trend forecasts then do consider becoming a Patron by supporting my work for just $4 per month. https://www.patreon.com/Nadeem_Walayat.
My analysis schedule includes:
- How to capitalise on the Meta-verse - Due Monday 21st Nov.
- UK House Prices Trend Analysis, including an update for the US and a quick look at Canada and China - 15% done
- How to Get Rich! - 90% done - This is a good 6 month work in progress nearing completion.
- US Dollar and British Pound analysis
- Gold Price Trend Analysis - 10%
Your analyst battening down the hatches for 10% CPI Inflation.
Nadeem Walayat
Copyright © 2005-2021 Marketoracle.co.uk (Market Oracle Ltd). All rights reserved.
Nadeem Walayat has over 35 years experience of trading derivatives, portfolio management and analysing the financial markets, including one of few who both anticipated and Beat the 1987 Crash. Nadeem's forward looking analysis focuses on UK inflation, economy, interest rates and housing market. He is the author of five ebook's in the The Inflation Mega-Trend and Stocks Stealth Bull Market series that can be downloaded for Free.
 Nadeem is the Editor of The Market Oracle, a FREE Daily Financial Markets Analysis & Forecasting online publication that presents in-depth analysis from over 1000 experienced analysts on a range of views of the probable direction of the financial markets, thus enabling our readers to arrive at an informed opinion on future market direction. http://www.marketoracle.co.uk
Disclaimer: The above is a matter of opinion provided for general information purposes only and is not intended as investment advice. Information and analysis above are derived from sources and utilising methods believed to be reliable, but we cannot accept responsibility for any trading losses you may incur as a result of this analysis. Individuals should consult with their personal financial advisors before engaging in any trading activities.
Nadeem Walayat Archive |
© 2005-2022 http://www.MarketOracle.co.uk - The Market Oracle is a FREE Daily Financial Markets Analysis & Forecasting online publication.


