Dow Forecasting Neural Nets, Crossing the Rubicon With Three High Risk Chinese Tech Stocks
Companies / Investing 2021 Sep 18, 2021 - 05:40 PM GMTBy: Nadeem_Walayat
Dear Reader
This is the concluding 2nd part of my recent extensive analysis (Part 1) focused on my continuing pursuit to gradually off load my stock analysis processing power onto neural nets, where part 2 looks at data preprocessing being critical in arriving at neural networks that output useful predictions as opposed to nonsense.
And then I literally crossed the rubicon in considering investing in three high risk Chinese tek giants given their relatively attractive valuations following their 2021 stock price blood bath in comparison to US tech stocks being driven to bubble mania valuation peaks.
AI Predicts AI Tech Stock Price Valuations into 2024, Time to Buy Chinese Tech Stocks?
contents:
- AI Stocks Value Forecaster (ASVF).
- How I Use ASVF6 - Percent Upwards Pressure (PUP)
- AI Stocks Buying Levels Plus ASVF & PUP
- AI Stocks Portfolio Buying Levels
- Dow Stock Market Trend Forecasting Neural Nets
- Pattern Recognition
- Trend Analysis Preprocessing
- Crossing the Rubicon With These Three High Risk Tech Stocks
- Cheap Chinese Tech Stock 1
- Cheap Chinese Tech Stock 2
- Cheap Chinese Tech Stock 3
- CME Black Swan
The whole of which first made available to Patrons who support my work. So for immediate first access to ALL of my analysis and trend forecasts then do consider becoming a Patron by supporting my work for currently just $3 per month that is soon set to increase to $4 per month for new Patrons, so a short window of opportunity exists to lock in at $3 per month https://www.patreon.com/Nadeem_Walayat.
Including access to my most recent extensive analysis that updates my stock market trend forecast as of 9th Feb that concludes in a detailed trend forecast from September 2021 into May 2022.
9th Feb 2021 - Dow Stock Market Trend Forecast 2021
Dow Stock Market 2021 Outlook Forecast Conclusion
Therefore my forecast conclusion is for the Dow to target a trend to between 34,500 and 35,000 by the end of 2021 for a gain of 13.5% to 15.2% on the year that should be punctuated by at least one significant correction starting early May 2021.
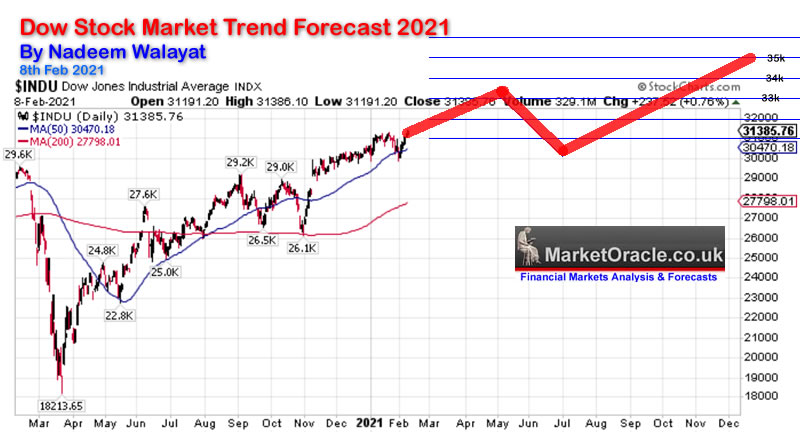
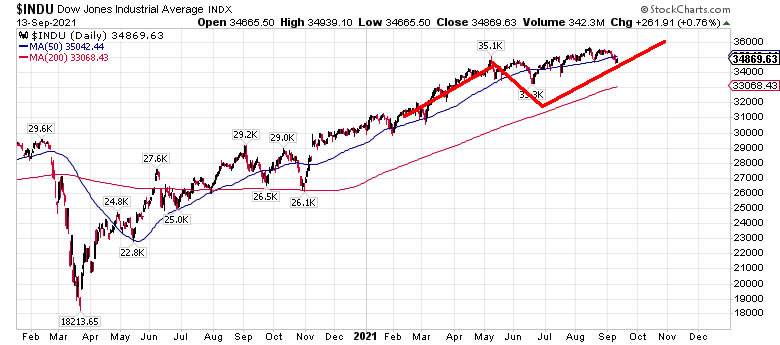
The updated graph shows that whilst the stock market did begin a correction early May and continued into Mid June, however in terms of price was nowhere to the expected extent and thus was one of the primary reasons why I took it as an opportunity to SELL into the highs.
Stock Market FOMO Hits September Brick Wall - Dow Trend Forecast Sept 2021 to May 2022
Contents:
- Stock Market Forecast 2021 Review
- Stock Market AI mega-trend Big Picture
- US Economy and Stock Market Addicted to Deficit Spending
- US Economy Has Been in an Economic Depression Since 2008
- Inflation and the Crazy Crypto Markets
- Inflation Consequences for the Stock Market
- FED Balance Sheet
- Weakening Stock Market Breadth
- Why Most Stocks May Go Nowhere for the Next 10 Years!
- FANG Stocks
- Margin Debt
- Dow Short-term Trend Analysis
- Dow Annual Percent Change
- Dow Long-term Trend Analysis
- ELLIOTT WAVES Analysis
- Stocks and 10 Year Bond Yields
- SEASONAL ANALYSIS
- Short-term Seasonal Trend
- US Presidential Cycle
- Best Time of Year to Invest in Stocks
- 2021 - 2022 Seasonal Investing Pattern
- Formulating a Stock Market Trend Forecast
- Dow Stock Market Trend Forecast Sept 2021 to May 2022 Conclusion
- Investing fundamentals
- IBM Continuing to Revolutionise Computing
- AI Stocks Portfolio Current State
- My Late October Stocks Buying Plan
- HIGH RISK STOCKS - Invest and Forget!
- Afghanistan The Next Chinese Province, Australia Living on Borrowed Time
- CHINA! CHINA! CHINA!
- Evergrande China's Lehman's Moment
- Aukus Ruckus
And my analysis schedule includes:
- Silver Price Trend Analysis, AI Stocks Portfolio Update - 30% Done
- How to Get Rich! - 90% done - This is a good 6 month work in progress nearing completion.
- UK House Prices Trend Analysis, including an update for the US and a quick look at Canada - 15% done
- US Dollar and British Pound analysis
- Gold Price Trend Analysis - 10%
So do consider becoming becoming a Patron by supporting my work at $3 per month before the price soon rises to $4 per month.
Dow Stock Market Trend Forecasting Neural Nets
So far all attempts to predict the Dow via machine learning have failed, as mentioned above feeding nets with obvious data such as open, close, high, low and then a candle chart version does not work. In fact the neural net part is the easy part via the likes of Tensor Flow. The problem is with the data which as I explained earlier needs to be preprocessed i.e. feeding raw data into the networks as inputs ends up with noisy networks, if it did work then it would be easy to successfully train neural nets and they would be widespread instead as far as I am aware there aren't really any neural nets out there that can successfully trade stocks.
So what does preprocessing actually mean?
There are 2 ways to go about preprocessing data for stock market forecasts.
1. Pattern recognition
2. Trend Analysis preprocessing.
1. Pattern Recognition
One only needs to look at the deep fake videos out there of what actually needs to be done in terms of preprocessing of IMAGES, creating a dataset of hundreds of preprocessed Images of market price charts, say covering a fixed 60 data points (days) each with the goal of predict the next 20 or so days, and there is no guarantee it will work though appears to be the best route to go down, given the success rate of image recognition algorithms, though it would result in a huge neural nets for instance a chart image with a resolution of 256 by 256 pixels would require at least 65,636 input layers! i .e. as the images are broken up and fed to the network
So obviously most of the work, perhaps 95% is in generating the dataset of market chart images where 150 years of Dow data at 60 data points (days) per image stepped every 20 days translates into about 1500 images. Would that be enough? Maybe it could work for a trained / labeled neural net but likely not be enough data for deep learning, the holy grail of machine learning.
So the problem with forecasting markets using neural nets is not with the neural nets, that's the easy bit, but rather creating the dataset's, a lot of time consuming trial and error and I suspect I am going to have to model the neural nets on what I actually do when analysing markets i.e. looking it on varying time frames, zooming in and out.
Likely 60 day data set will not be enough, so require separate neural nets trained with 120 day, and 230 day (1 year) price chart images etc. That acts as preprocessed inputs to the next network, will that work?
Maybe I will need to add nuances by creating dataset's i.e instead of candle charts use swing charts, maybe point and figure etc. Maybe separate neural nets on each dataset that feeds its output as inputs into the next neural net.
2. Trend Analysis Preprocessing
Along with image recognition there is going down the EC route i.e. full spectrum trend analysis, which effectively would mean reinventing the wheel, writing thousands of lines of code in attempts to convert price data into trend analysis data points which basically means creating a whole host of of expert systems that pre-analyse the price data before it is fed into neural nets that along the lines with the EC indicator would each take a huge amount of fine turning, and likely end up with separate useful expert systems in their own right, I.e. trend analysis such as price patterns, support resistance, trend lines, MACD, seasonality, elliot waves. I say reinventing the wheel because I've already done all of this before and more from the Mid 1990's to the early 2000's when I created a multitude of market expert systems and automated technical trading tools, in fact I even had a primitive AI neural net attempting to LEARN from preprocessed data though of course one cannot compare then with now in terms of machine learning as we now have -
a. Infinitely greater compute power! There is no comparison between what one can do with a high end system today than one from 2000.
b. That using neural networks today's is a doddle! About a million times easier than in 2000! In 2000 one only had snippets of information i.e. layers of neurons all connected together by weights was about the extent of information available with much yet to be discovered / invented over the next 20 years.
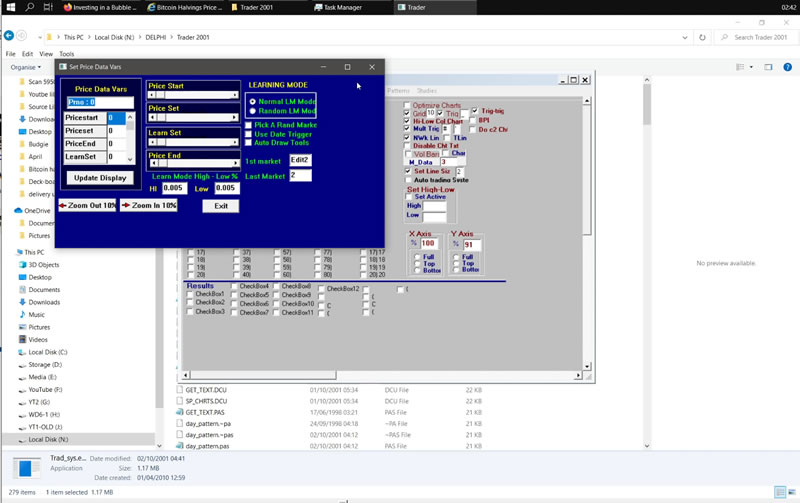
So I have literally been there and DONE that over a period of about 7 years from around 1994 to 2001, creating what was probably at the time one of the worlds most sophisticated Trend Analysis development environments that I called "TA Dev", literally decades ahead of its time where I included everything I could think of during those 7 years such as Chart pattern recognition,, swing Trader, a primitive neural network, Elliott Waves generator,, seasonal analysis, trading systems galore, and the requisite full spectrum charting etc. But what it lacked at the time was PROCESSING POWER and probably also MEMORY to hold all of the data and variables so was very resources hungry.
A short 3 min video of running the program 20 years later. https://youtu.be/b68yZGc7AmA
The program was good for testing strategies and observations, conducting studies and pattern recognition but was overkill for what was needed to actually trade. During that time period I basically did TA to death! The program was written in Borland Delphi (pascal), which died a slow death during the early 2000's with the last iteration being Delphi 7 (2002) though the last version I actually used was Delphi 5. After Delphi 7 it all become a bit of a mish mash mess, a series of incompatible stop start nonsense that I will now need to sort through to see what could actually work as I attempt to resurrect 'Ta Dev" to use towards generating data for inputs to neural nets.
The last compiled executable of the trading development environment is dated 2nd October 2001 which I managed to get to run under Windows 10 under Window XP service pack 3 compatibility mode, but as has been the case for well over a decade the program fails to load any data into memory probably due to deprecated DLL's that the program is attempting to call.
So the first step is to get an Delphi IDE up and running and then get the code working so that it loads data. If this turns out to be impossible under Windows 10 then an XP system will need to be built.
The twin goals of the software will be to convert the various automated generators to provide preprocessed data for the neural net, and write new code to generate standardised charts for image pattern recognition, that should be straight forward to generate many hundreds of images of charts at the click of a button.
Crossing the Rubicon With These Three High Risk Tech Stocks
With Western tech corps trading on inflated bubbling valuations where is one to look for value? Phase 1 was to look at the downtrodden small cap biotech sector. Phase 2 was to look at the crypto's following the bursting of their bubble that has seen crypto's fall by 50% to 80% with much further to go.
So where next?
We'll there is a sector that has suffered a significant correction with stocks trading on relatively low multiples and unlike so called 'value' stocks have the potential to multiply many times. However, for this potential reward one carry's a far higher risk than one is used with the US tech giants.
The perfect stocks to buy would be our tech giants trading on much fairer multiples, but for that we are going to have to wait for the cookie to crumble with the less experienced investors and fund managers to realise that the likes of Nvidia are priced at 100 YEARS to earn it's share price!
So what do we do? We cross the Rubicon or the Yangtze river and seek value in that other worldly high risk high stakes poker game called CHINA!
So here follow 3 select CHINESE STOCKS that I expect to deliver between X3 to X4 over the next 5 years.
These 3 stocks are not something I've just come up with out of the blue by running screening exercises as was the case for the biotech stocks, but are well known large cap chinese stocks that have a track record that all of us have been aware of for some YEARS, in fact you might even be invested in some of them, though if you are hopefully you won't have bought them near their earlier highs as they have been on a bearish trend trajectory which gives my a window of opportunity that does not exist in the West to buy cheap when no one wants to touch them with a barge pole and sell them HIGH when everyone will be clambering to buy a stake at the highs just as is the case with the US tech stocks today.
BUT UNDERSTAND THIS, these stocks despite what their market capitalisation suggests ARE HIGH RISK! Both due to falling prey to the CCP and the US administration as we are literally crossing the Rubicon into enemy investing territory.
For instance there exists the risk of the stocks getting delisted which if it happens would make it a pain in the butt to trade out of them, However the simple solution to this would be to buy them on other exchanges such the Hong Kong, UK investors already incur a forex fee when buying US listings so buying in HKD is not that big of a deal, remember were not investing for few pennies, 10% 20%, but instead several hundreds of percent in which case the fx fees should not make much difference.
This could be a good time to accumulate a small position given that the chinese tech stocks are sharply lower year to date, down typically 20% to 30%, largely in response to increased scrutiny from the CCP that has been busy issuing billion dollar fines..
Baidu (BIDU) $172 - 0HL1B - HKG: 9888 - Google Clone
Baidu is a mini Google that continuous to keep a beady eye on what Google is upto so that it can then copy, ripping off what Google does by replicating it in China.
Now here's your electric shock - Google Trades in a PE of 35 / Market Cap of $1.78Trillion. Guess what Baidu trades on ?
Trailing P/e of 8.3, Market cap of $62 billion, now Google is a great corp but it's a lot easier to double by going from a market cap of $62 billion than $ 1.8 trillion ! And even if Baidu X10 from here it would still only be worth 1/3rd of what Google is today! Okay so forward P/E rises to 15 but that still puts the growth stock in the cheap zone (under a PE of 20).
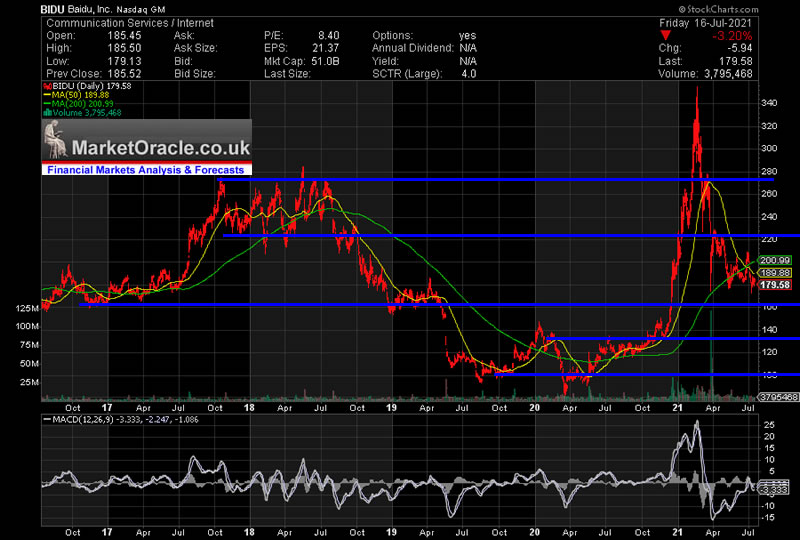
In fact years ago I actually held shares in Baidu which I exited for my oft mentioned reasons of carrying geopolitical risks, so I know the stock well for many years. What has the stock done since I disinvested, first if was already weak going into Pandemic low, but then soared like a pocket rocket to new highs of $350 before giving up virtually all of the gains to currently stand at $173.
(Charts courtesy of stockcharts.com)
It's clearly in a downtrend but there is very heavy support under the market, from $150 to $200, and then at $140. So Baidu is virtually in the middle of it's major support 'buying' zone an area that is good to accumulate in, if only US stocks could come down to such accumulation zones.
I am tempted to buy an opening stake right now and then additional stake at around $154 that's about a 15% discount from the current price.
Objectives, well the initial objective is $340, it's recent high, beyond that depends on annual earnings growth, but the stock could easily find itself growing on an PE of 25+, so the stock is cheap in valuation terms. And I could easily see it trade to $750 in 5 years time.
So even though the trend is DOWN, I consider Bidu to be trading AT it's buying level of $173, with a secondary buying level of $154, so I will be buying a small stake in Baidu on Monday and maybe a similar amount again at around $154.
Alibaba - BABA $203 - 9988.HK - China's Amazon Clone
Alibaba trades on a trailing PE of 22 and forward PE of 23 with earnings growth of 22% and on a market cap of $565bn. The stock price is down 1/3rd on its Oct 2020 high of $320, currently standing at $203, trading AT significant support. at $200. The next support level lower is at $170 to $190 so I am not seeing much further downside.
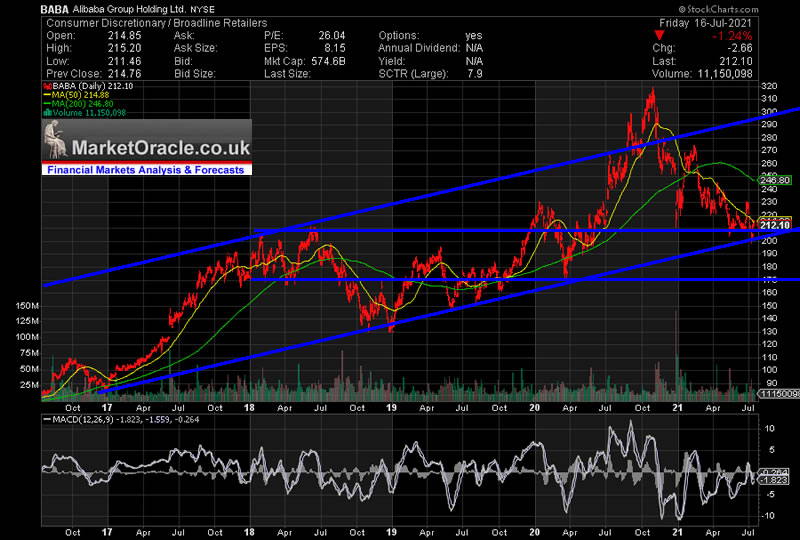
Clearly the market does not like chinese stocks right now which could make this an opportune time to buy Alibaba shares on a PE of just 22, remember folks this is an Amazon clone, what does Amazon trade at ? A trailing PE of 68! More than TRIPLE Alibaba. So with little downside I am going to be buying exposure to this Amazon clone later today (Monday) and then again on any dip into the $190- $170 trading zone especially as apparently Cathy Woods ARK funds recently sold out of Alibaba and other chinese tech recently (after the price drop) which is a good buy signal :)
What about upside, extrapolating the earnings growth and say half Amazons PE than that would put the stock at X2.5 to X3.5 over the next 5 years, $530 to $730.
Tencent - TCEHY $69 - 0700.HK
Another Chinese Google Clone , internet services / AI etc. Over the past 5 years the stock X4 from a low of $25 to a high of $100, currently correcting lower by a significant 30% that puts the chinese tech giant on a market cap of $678bn and a PE of 25.5 which is a little high though Tencent does have decent earnings growth with a net profit margin of 25%.
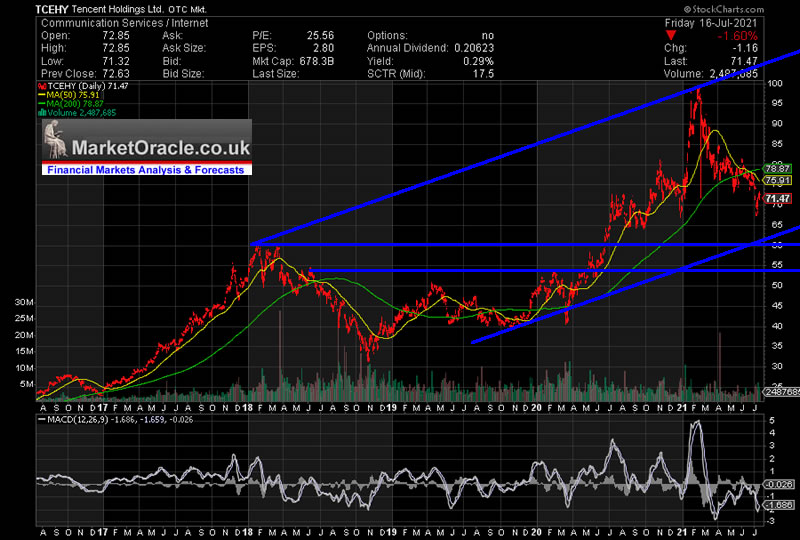
So can the stock X4 again during the next 5 years?
Well despite the 30% correction to date the stock is still over priced, preference would be to look at buy at a PE of 20 or lower. The stock is currently trading in the support zone of $65 to $73 which if it fails to hold could send the price down to $53, which would be a 25% drop on the current price and translate into a PE of about 19. An invest at $55 would offer the scope to X3 or X4 over the next 5 years, therefore I will be seeking to buy a stake in Tencent at around a Buying Level of $55 that would put a target high during the next 5 years at between $165 and $220.
And remember folks the best time to buy stocks are when they are HATED and as the above charts illustrate chinese stocks are hated right now. I will be listing these stock along with further the high risk bio tech stock and see if I can generate an EC ratio and and ASVF price forecast in my next analysis.
CME Black Swan
I finally got around to converting one of my potential high probability black swan events into a video, the Earth being hit with a Massive Solar Coronal Mass Ejection the risks of which I shared with Patrons in my analysis of 24th November 2020.
I will take a look at the stock markets trend in a forthcoming analysis, whilst my next analysis will finally deliver the additional 5 biotech stocks with the potential to 10X and as a bonus I will be including a high risk tech stock also with the potential to 10X.
Again for immediate access to all my work do consider becoming a Patron by supporting my work for just $3 per month that is soon set to increase to $4 per month for new Patrons, so a short window of opportunity exists to lock in at $3 per month. https://www.patreon.com/Nadeem_Walayat.
My analysis schedule includes:
- Silver Price Trend Analysis, AI Stocks Portfolio Update - 30% Done
- How to Get Rich! - 90% done - This is a good 6 month work in progress nearing completion.
- UK House Prices Trend Analysis, including an update for the US and a quick look at Canada - 15% done
- US Dollar and British Pound analysis
- Gold Price Trend Analysis - 10%
Your analyst.
Nadeem Walayat
Copyright © 2005-2021 Marketoracle.co.uk (Market Oracle Ltd). All rights reserved.
Nadeem Walayat has over 35 years experience of trading derivatives, portfolio management and analysing the financial markets, including one of few who both anticipated and Beat the 1987 Crash. Nadeem's forward looking analysis focuses on UK inflation, economy, interest rates and housing market. He is the author of five ebook's in the The Inflation Mega-Trend and Stocks Stealth Bull Market series that can be downloaded for Free.
 Nadeem is the Editor of The Market Oracle, a FREE Daily Financial Markets Analysis & Forecasting online publication that presents in-depth analysis from over 1000 experienced analysts on a range of views of the probable direction of the financial markets, thus enabling our readers to arrive at an informed opinion on future market direction. http://www.marketoracle.co.uk
Disclaimer: The above is a matter of opinion provided for general information purposes only and is not intended as investment advice. Information and analysis above are derived from sources and utilising methods believed to be reliable, but we cannot accept responsibility for any trading losses you may incur as a result of this analysis. Individuals should consult with their personal financial advisors before engaging in any trading activities.
Nadeem Walayat Archive |
© 2005-2022 http://www.MarketOracle.co.uk - The Market Oracle is a FREE Daily Financial Markets Analysis & Forecasting online publication.


