


Are Stock Markets Ready For An August Surprise?
Stock-Markets / Stock Market 2021 Aug 08, 2021 - 09:42 PM GMTBy: Chris_Vermeulen

One thing that seems to be certain in the markets right now is the past hyper-bullish trending which appears to have weakened since early 2021. As a result, the longer-term Custom Indexes we use to help gauge and understand market trends are showing a very clear weakening of trends.
In this article, we are going to review three of our custom index charts on a weekly chart basis, the Custom US Stock Market Index, the Smart Cash Global Market Index, and the Custom Volatility Index. Each of these charts highlights something unique related to current market trends.
Use this information to read between the line and to help establish your own expectations for the markets going forward. We’ll provide our conclusion near the end of this research article.
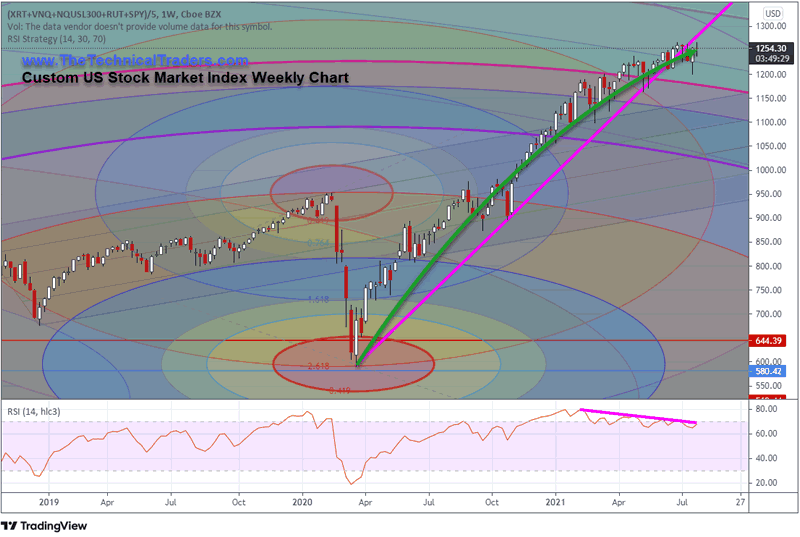
Custom US Stock Market Shows Divergent Market Trends
This Weekly US Stock Market Index chart highlights the rally from the November 2020 election into the start of 2021. After that peak is reached in late February, one can clearly see the divergence on the RSI indicator. Below, those trends counter to the moderate price rally phase on the chart. We believe this divergence is essential after such a strong rally and may be setting up a market base/momentum base where price may attempt another rally in the near future.
As of right now, we have not seen a breakdown event on this weekly chart, although one may take place before any new rally attempt starts. What we are seeing is a decidedly weaker price trend and a consolidation phase in the markets after the hyper-bullish rally phase of the past 15+ months.
Be sure to sign up for our free market trend analysis and signals now so you don’t miss our next special report!
The breakdown of the upward price trend, below the MAGENTA trend line, is a bit concerning, but overall the markets have not shown any extreme weakness yet and may continue to push higher after a brief consolidation/basing setup.
Still, traders and investors should be somewhat concerned that any breakdown in price may prompt a -13% to -18% pullback – targeting the $1025 level on this chart.
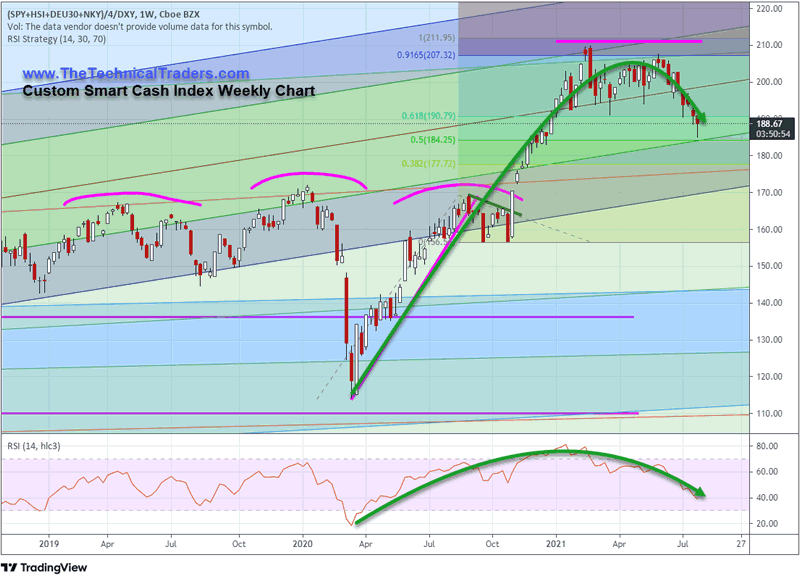
Global Market Trends Decidedly Weaker Than The US Markets
This Custom Smart Cash Index Weekly Chart is more global market-based, including the SPY, DAX, Hong Kong, and Hang Seng Indexes. This chart is used to show us how the global markets are reacting to market trends while attempting to balance US market activity and US Dollar strength. What we can see from this chart is that the Custom Smart Cash Index has rolled sideways after the February 2021 peak and has recently started to break downwards near the end of July 2021.
This extended 4+ month sideways price channel suggested the global markets failed to continue to rally as the US markets did from February through July 2021. This breakdown in trending between the global markets and the US markets suggests foreign markets are starting to retrace much more than the US markets are.
This suggests the Foreign markets are starting a mid-year price correction that may continue to move lower and attempt to target the $160 to $175 level before finding support. If this happens, the US markets may eventually break lower and attempt to follow the foreign markets downward as a moderate contraction event (reversion event) takes place after the strong bullish rally from the March 2020 COVID-19 lows.
An interesting component of the global market trends is setting up that also took place in July/August 2015, February 2018 through almost all of 2018, February 2020 (just before COVID hit), and now. If this setup is valid, as it has been in the past, then the US markets are likely going to enter a period of sideways, possibly downward, price trending fairly soon if the Custom Smart Cash (global) Index continues to fall.
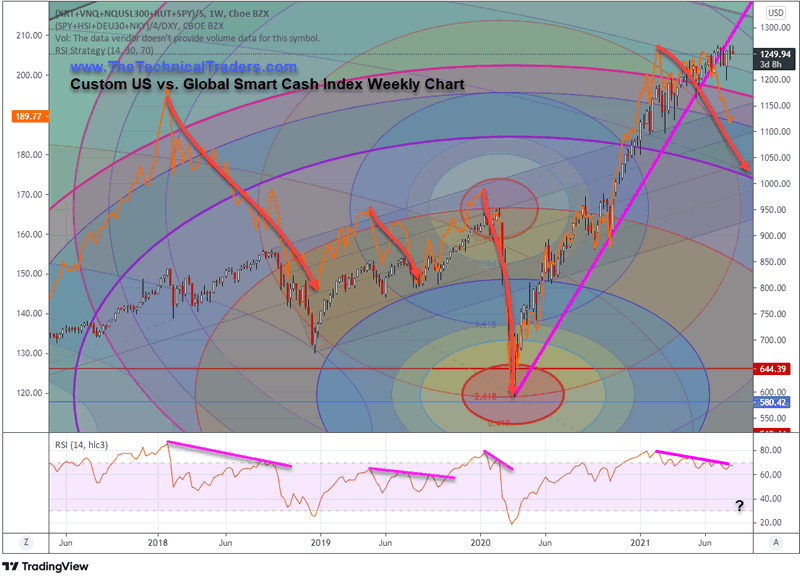
Combined Custom US & Smart Cash (Global) Index Weekly Chart
This combined Custom US & Smart Cash (Global) Index Weekly chart paints a very clear picture of the type of technical price pattern that is currently unfolding. The ORANGE line on the chart is the Custom Smart Cash (Global) Index Weekly data. The Japanese Candlesticks are the Custom US Index Weekly data.
What we’ve attempted to show you on this chart is how the Custom Smart Cash Index tends to break downward many weeks, or months, before the US market begins a move downward or sideways. For example, in early 2018, the Smart Cash Index peaked and rolled downwards while the US market entered a period of extreme volatility. The Smart Cash index continues to move downward while the US Market Index recovered. Until September 2018, when the US markets broke strongly to the downside as the US Fed pushed rates just a bit too far.
With the Custom Smart Cash (Global) Index moving decidedly lower recently, and really starting to break downward, are we nearing a reversion event in the US market? Have the markets transitioned away from the hyper-bullish trending phase and started a new phase of price trending that traders/investors are unaware of?
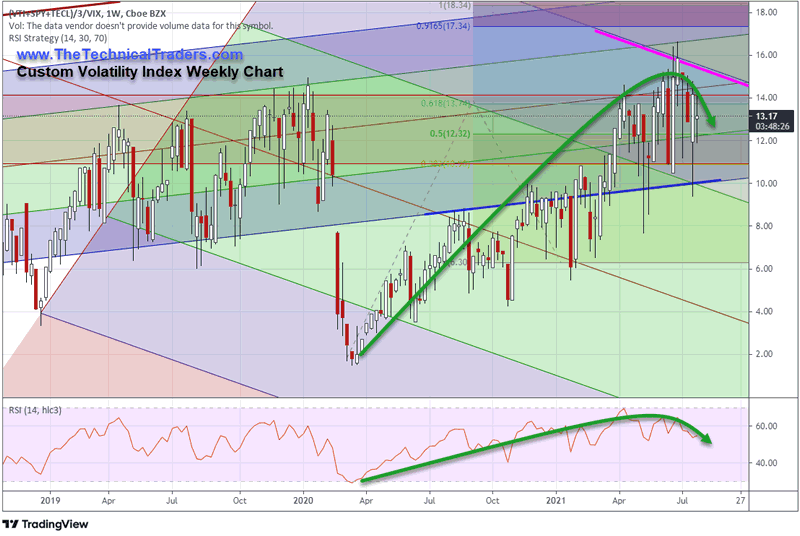
Custom Volatility Index Suggests Extreme Overbought Levels Have Been Reached In April/June 2021
This Custom Volatility Index Weekly chart shows how the markets rallied after the November 2020 US elections, through the reflation trade expectations, and pushed even higher in early 2021. The Custom Volatility Index chart peaked in April 2021 and peaked even higher in late June 2021. These peak levels, above 13.5 to 14.0, are historically very high overbought levels on this chart. Whenever the Custom Volatility Index reaches levels above 11 or 12, a moderate price peak usually sets up within a few days or weeks.
There was only one other time in recent history where the Custom Volatility Index level closed above 14, and that was January 2020, the peak price level just before COVID-19 hit the markets.
The most recent Custom Volatility Index highs, above 15, are the highest levels printed on this chart over the past 20+ years. They represent extreme overbought market levels and the Custom Volatility Index has already started to move downward from these peaks.
A move on this Index below 7~8 would represent a fairly strong downside price correction – representing a possible intermediate bottom setup.
A move below 5~6 on this Index would represent very strong selling, likely pushing the markets into a moderate downside price event that may last many weeks or months.
Our research has not confirmed any bearish price setup or any immediate actions to take related to the potential for a peak or rollover price event based on these charts. Our research suggests the US markets may continue to “melt upward” for a period of time as global investors pour into the US equities markets in search of profits and safety. Yet, underlying all of this, we still see some warning signs that the markets are starting to diverge in a way that is somewhat similar to past breakdown events with the Custom Index charts.
We are attempting to present this information so you can become better prepared for the potential price swings related to this type of reversion event and attempt to protect your open trades before any volatility event takes place. There are going to be some really big price swings taking place over the next 24+ months. Make sure you are prepared to profit from these big events. Don’t let yourself get caught in these next cycle phases unprepared.
Want to know how our BAN strategy is identifying and ranking various sectors and ETFs for the best possible opportunities for future profits? Please take a minute to learn about my BAN Trader Pro newsletter service and how it can help you identify and trade better sector setups. My team and I have built this strategy to help us identify the strongest and best trade setups in any market sector. Every day, we deliver these setups to our subscribers along with the BAN Trader Pro system trades. You owe it to yourself to see how simple it is to trade 30% to 40% of the time to generate incredible results.
Have a great day!
Chris Vermeulen
www.TheTechnicalTraders.com
Chris Vermeulen has been involved in the markets since 1997 and is the founder of Technical Traders Ltd. He is an internationally recognized technical analyst, trader, and is the author of the book: 7 Steps to Win With Logic
Through years of research, trading and helping individual traders around the world. He learned that many traders have great trading ideas, but they lack one thing, they struggle to execute trades in a systematic way for consistent results. Chris helps educate traders with a three-hour video course that can change your trading results for the better.
His mission is to help his clients boost their trading performance while reducing market exposure and portfolio volatility.
He is a regular speaker on HoweStreet.com, and the FinancialSurvivorNetwork radio shows. Chris was also featured on the cover of AmalgaTrader Magazine, and contributes articles to several leading financial hubs like MarketOracle.co.uk
Disclaimer: Nothing in this report should be construed as a solicitation to buy or sell any securities mentioned. Technical Traders Ltd., its owners and the author of this report are not registered broker-dealers or financial advisors. Before investing in any securities, you should consult with your financial advisor and a registered broker-dealer. Never make an investment based solely on what you read in an online or printed report, including this report, especially if the investment involves a small, thinly-traded company that isn’t well known. Technical Traders Ltd. and the author of this report has been paid by Cardiff Energy Corp. In addition, the author owns shares of Cardiff Energy Corp. and would also benefit from volume and price appreciation of its stock. The information provided here within should not be construed as a financial analysis but rather as an advertisement. The author’s views and opinions regarding the companies featured in reports are his own views and are based on information that he has researched independently and has received, which the author assumes to be reliable. Technical Traders Ltd. and the author of this report do not guarantee the accuracy, completeness, or usefulness of any content of this report, nor its fitness for any particular purpose. Lastly, the author does not guarantee that any of the companies mentioned in the reports will perform as expected, and any comparisons made to other companies may not be valid or come into effect.
Chris Vermeulen Archive |
© 2005-2022 http://www.MarketOracle.co.uk - The Market Oracle is a FREE Daily Financial Markets Analysis & Forecasting online publication.