


Are Apple, Tesla, and Bitcoin Entering Market Technical Excess Top Phase?
Stock-Markets / Financial Markets 2021 May 18, 2021 - 05:53 PM GMTBy: Chris_Vermeulen

In the first part of this research series, I highlighted the broad market cycles and what technical analysts call the “Excess Phase Top” process, which usually takes place after the market’s peak and set up a downward price trend. There are a number of technical setups that take place throughout this process. Today, I will be exploring the charts of Tesla (TSLA), Apple (AAPL), and Bitcoin (BTC) to see where they are in the process.
The suggestion I am making by highlighting these market trends and setups is that a Cash Position is a viable allocation of capital away from risks and losses. Many traders don’t view a cash position as a properly allocated use of capital. We believe taking a cash position at the right times can and does provide very clear benefits, including:
- Eliminating risks of further losses/drawdowns.
- Setting up a process of protecting cash and waiting for a confirmed re-entry trigger.
- Avoiding the failure of buying into a declining market – which is one of the biggest faults of active traders.
- Using the Cash position as a hedge against shifting currency/market valuations.
Remember, in many cases, broad market downtrends are often associated with bigger trends in currencies and global market sectors. Chasing these trends can lead to further risks if you are not careful and skilled in your trading decisions. Keeping your capital in a Cash Allocation/Position is often the easiest and safest way for you to ride out volatile downside price trends and allows you to re-deploy your cash into new trades when the time is right.
Understanding Broad Market Cycles & Trends
Before we get started, we are going to share the broader market cycles chart with you to refresh your memory (or if you missed the first part of this research article).
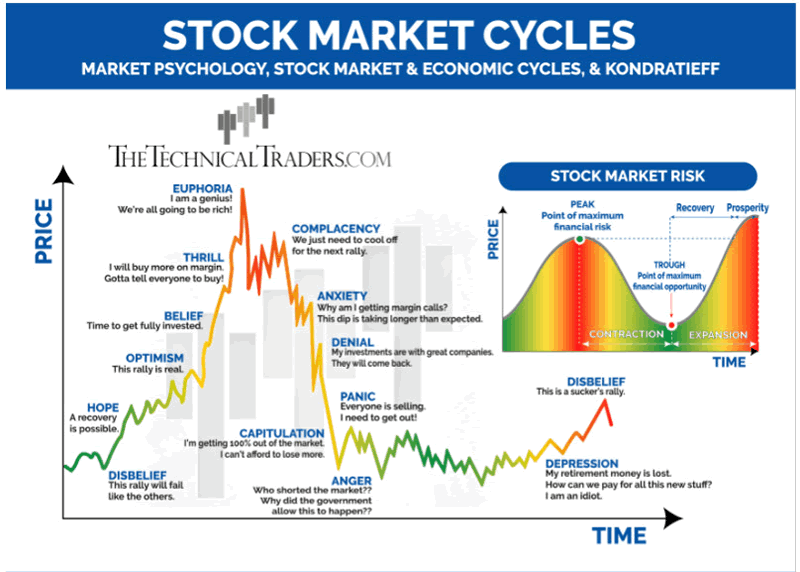
Before looking at the charts, please bear in mind that these patterns often take place over many months. Usually, the initial topping (#1) phase and flagging formation (#2) take place over a 60 to 90+ day span of time. Yes, sometimes these setups can take place over shorter spans of time, but usually, they last over 60+ days.
Additionally, the breakdown of the Flag formation (#2), which leads to the setup of intermediate support (#3), can often take many months to complete as well. My research team and I have seen the Flagging setup last well over 30 days at times and after the immediate support level is reached, markets sometimes attempt to move sideways for many weeks/months before attempting to break below that support level.
APPLE Continues To Flag Out – Watch for potential breakdown below $115
The Weekly AAPL chart below highlights the rally from $35 to over $140 over the past 2.5 years (notice the price split that happened in 2020). This rally reached a peak near January 25, 2021 (#1) and has fallen nearly 20% from the peak levels before starting a sideways Flag formation (#2). This type of setup completes the first two processes of the Excess Phase Top setup and aligns with the broader market cycles to suggest we may have entered the “Complacency” phase of price trending.
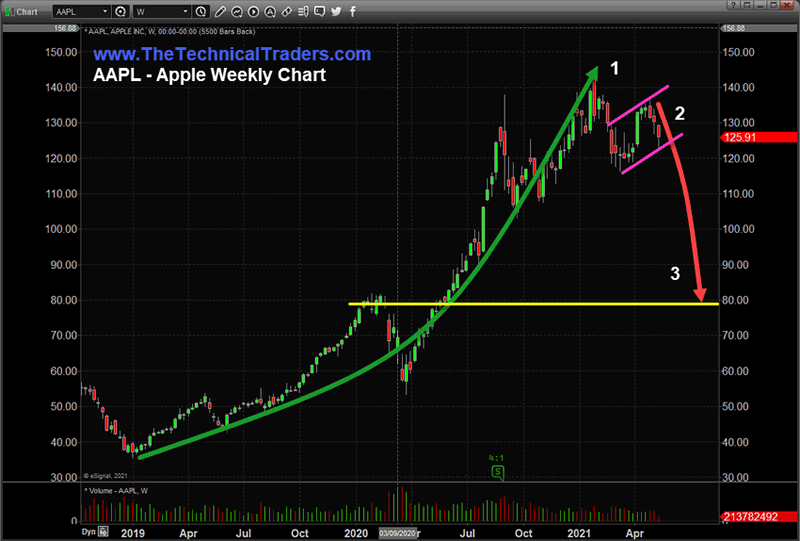
The sideways Flagging pattern (#2) on this chart suggests AAPL may continue to move within this price channel before attempting to either recover, by moving to new highs or to break below the $115 level (#3), which would confirm the next phase of the Excess Phase Top pattern. \
If we see any continued breakdown in price, traders need to prepare for the markets to attempt to move downward, targeting historical support levels, where we expect price to consolidate for many weeks/months. I have drawn a YELLOW line near a very clear support level for AAPL near $80 as a potential downside price target. If this Excess Phase Top pattern fails, we will likely see AAPL rally back above $145 and attempt to break into a new bullish trending phase.
Tesla Breaks Below Flag Channels – What’s Next?
The following Weekly TSLA chart highlights the rally from $73 to over $900 over the past year (note the price split that happened in 2020). This rally also reached a peak near January 25, 2021 (#1) and has fallen nearly 40% from the peak levels before starting a sideways Flag formation (#2). At this phase of price action, we can see TSLA has recently broken below the lower Flag price channel and may be attempting to start a downward price trend where price will seek out intermediate support.
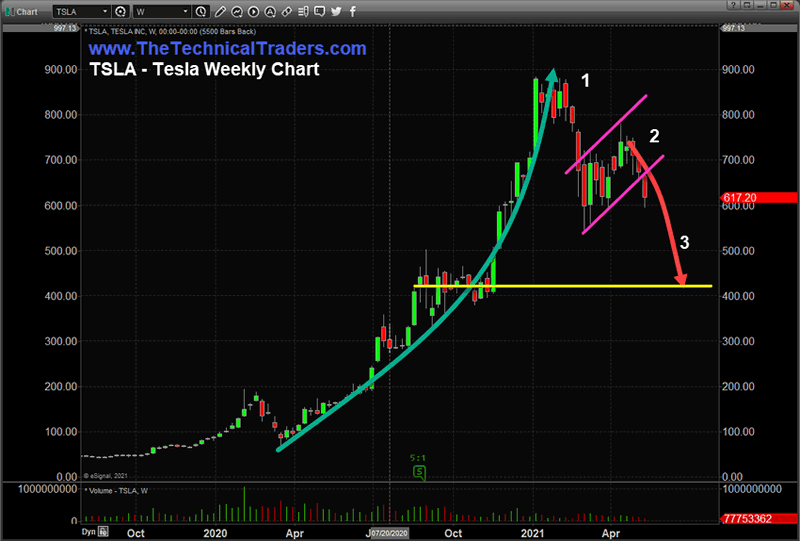
I have drawn a YELLOW line near a very clear support level for TSLA near $430 as a potential downside price target for this next phase of the Excess Phase Top pattern (#3). From a technical standpoint, if the support level near recent lows, near $540, holds, and price is unable to move below this level, then we may see a technical failure of the Excess Phase Top pattern.
Be sure to sign up for our free market trend analysis and signals now so you don’t miss our next special report!
The move to the intermediate support level, which must be lower than the lows of the Flag formation, is critical in confirming the move into “Complacency” and the transition into “Anxiety” on the Broad Market Cycle example. Without this subsequent breakdown in price happening, we would consider the Excess Phase Top pattern potentially invalid (or failed) and start to watch for any new upside price trending – eventually targeting recent highs near $780. At this point, the $540 lows have become the new critical price level for TSLA and we are expecting price to continue to move lower, possibly breaching the $540 level.
Bitcoin Gaps Lower After Peak & Breaks Flag Lows – What’s Next?
This last chart for Daily BTC Futures highlights the rally from $10,200 to over $65,500 over the past 7.5 months. This rally reached a peak near April 14, 2021 (#1) and Gapped lower on April 19, 2021. The recent downside price move from that peak totaled nearly -27% before starting a sideways Flag formation (#2). In order to confirm the next phase of this Excess Phase Top pattern, we would watch for price to break lower, breaking the Flag formation channels, and attempt to break below the recent support level near $47,440. If we see a strong breakdown in price where closing price levels break below $47,440, I would expect price to move quickly below $40,000 and attempt to seek out critical support.
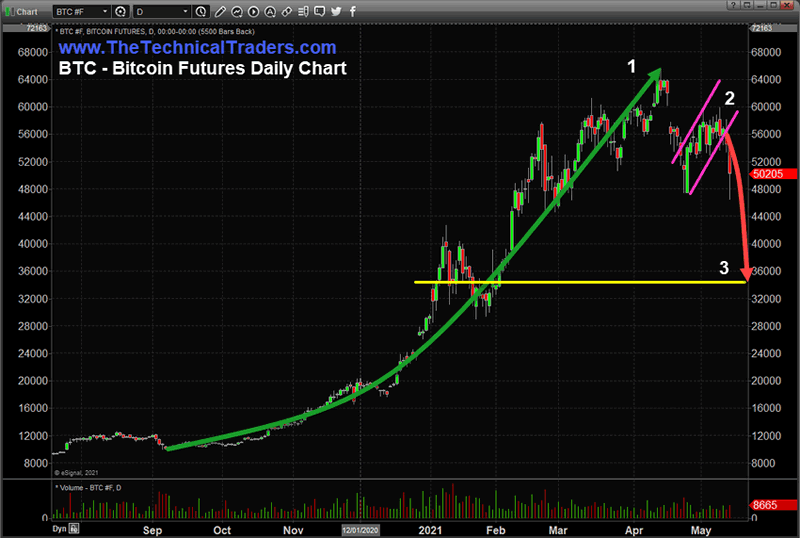
I have drawn a YELLOW line near a very clear support level for BTC near $34,250 as a potential downside price target for this next phase of the Excess Phase Top pattern (#3).
Recently, Bitcoin broke below the Flag formation lower channel and briefly traded below support near $47,440. If we continue to see downward price trending where price closes below this level, I would consider this technical confirmation of the Excess Phase Top pattern, suggesting price will attempt to continue moving lower while trying to seek out intermediate support (near the YELLOW line possibly).
At this point, Bitcoin is showing moderate weakness and has already attempted to break recent support. Any confirmation of further downward trending could push us out of the Complacency phase and into the Anxiety phase of the broad market cycles. Are you ready for what’s next?
The question of “Should You Be In Cash” right now is a very valid concern for many traders/investors. Learning how to identify and understand risks and technical patterns/setups in the markets is critical to understanding how to protect and grow your wealth. Additionally, learning to use the Cash Position, and proper position sizing, as a valid type of trading allocation is essential, in our thinking, to protect your assets throughout volatile market trends. The next 12 to 24 months are almost certain to include much higher price volatility and big price rotations/trends, which will translate into incredible opportunities for traders/investors. You can learn more about how I identify and trade Gold, Silver, and the markets by watching my FREE step-by-step guide to finding and trading the best sectors.
For those who believe in the power of trading on relative strength, market cycles, and momentum but don’t have the time to do the research every day then my BAN Trader Pro newsletter service does all the work for you with daily pre-market reports, proprietary research, and trade alerts. More frequent or experienced traders have been killing it trading options, ETFs, and stocks using my BAN Hotlist ranking the hottest ETFs, which is updated daily for my premium subscribers. Sign up today!
Chris Vermeulen
www.TheTechnicalTraders.com
Chris Vermeulen has been involved in the markets since 1997 and is the founder of Technical Traders Ltd. He is an internationally recognized technical analyst, trader, and is the author of the book: 7 Steps to Win With Logic
Through years of research, trading and helping individual traders around the world. He learned that many traders have great trading ideas, but they lack one thing, they struggle to execute trades in a systematic way for consistent results. Chris helps educate traders with a three-hour video course that can change your trading results for the better.
His mission is to help his clients boost their trading performance while reducing market exposure and portfolio volatility.
He is a regular speaker on HoweStreet.com, and the FinancialSurvivorNetwork radio shows. Chris was also featured on the cover of AmalgaTrader Magazine, and contributes articles to several leading financial hubs like MarketOracle.co.uk
Disclaimer: Nothing in this report should be construed as a solicitation to buy or sell any securities mentioned. Technical Traders Ltd., its owners and the author of this report are not registered broker-dealers or financial advisors. Before investing in any securities, you should consult with your financial advisor and a registered broker-dealer. Never make an investment based solely on what you read in an online or printed report, including this report, especially if the investment involves a small, thinly-traded company that isn’t well known. Technical Traders Ltd. and the author of this report has been paid by Cardiff Energy Corp. In addition, the author owns shares of Cardiff Energy Corp. and would also benefit from volume and price appreciation of its stock. The information provided here within should not be construed as a financial analysis but rather as an advertisement. The author’s views and opinions regarding the companies featured in reports are his own views and are based on information that he has researched independently and has received, which the author assumes to be reliable. Technical Traders Ltd. and the author of this report do not guarantee the accuracy, completeness, or usefulness of any content of this report, nor its fitness for any particular purpose. Lastly, the author does not guarantee that any of the companies mentioned in the reports will perform as expected, and any comparisons made to other companies may not be valid or come into effect.
Chris Vermeulen Archive |
© 2005-2022 http://www.MarketOracle.co.uk - The Market Oracle is a FREE Daily Financial Markets Analysis & Forecasting online publication.