


Keys to US / Global Economic Recovery - Part 2
Economics / Economic Stimulus Mar 14, 2021 - 05:19 PM GMTBy: Chris_Vermeulen

This is a continuation of our extended technical review of what my research team and I believe will be required for the US/Global markets to enter a stronger post-COVID-19 recovery phase. If you missed Part I of this research series then you can find it here: www.thetechnicaltraders.com/....
In this Part II, we will look at how potential currency shifts will prompt new trending in various economic sectors. The past 20+ years have really changed how the markets operate from a standpoint of capital deployment and capital function. We certainly live in interesting times from a trader and investor perspective. There is more capital floating around the globe right now than ever before… and that changes certain things.
The Components Of A Frenzied Global Market
The first and most notable change is to create volatility at levels we have really never seen before. The average daily price range on the QQQ or SPY charts is more than 3x historical price range levels. This simple fact shows that a 1% price range, which used to be considered a moderately large price range for the price to move, is now considered a below normal range. This new level of volatility has applied to many of the largest SPY and NASDAQ-related stock symbols over the past few years as capital was deployed into various sectors with increasing speed and volition.
We profit from volatility by using non-directional options trading strategies so watch our webinar on How To Become An Options Strategy Master now!
The US and global central banks have continued to deploy easy money policies since the 2008-09 Housing/Credit crisis which has perpetuated a Roaring-20s type of mentality throughout the world. Even though we could point out certain nations that are underperforming economically, generally the world has seen an unprecedented rise in credit, debt, and associated spending capabilities over the past 10+ years. This level of unusual economic expansion comes with certain consequences, similar to the expansion that led up to the 2008-09 Housing/Credit crisis.
It also has to be noted that COVID-19 has really altered the way consumers are engaging in the economy right now. Online, stay-at-home, avoid outside risks type of activities have really become the new normal. Many sociologists continue to suggest consumers may be slower to move back into old economic habits (pre-COVID-19 spending habits). This change in how people perceive risks and adopt new economic processes will likely lead to a rise in digital productivity, the adoption of technology solutions, and a change of spending habits, which could prompt a much bigger transition for certain market sectors that have been overlooked recently.
One thing that has certainly benefited from COVID-19 is the number of new investors/traders plying their skills (and hard-earned cash) in the markets. We’ve never seen anything like this explosive growth in retail market participation over the past 20+ years. The closest we’ve come to this level of retail trader participation in the equities and financial markets was in 1998~99 during the height of the DOT COM bubble. This incredible consumer participation in the global equities trends/trading has helped propel many US major indexes/sectors to incredible heights – and it may not end any time soon.
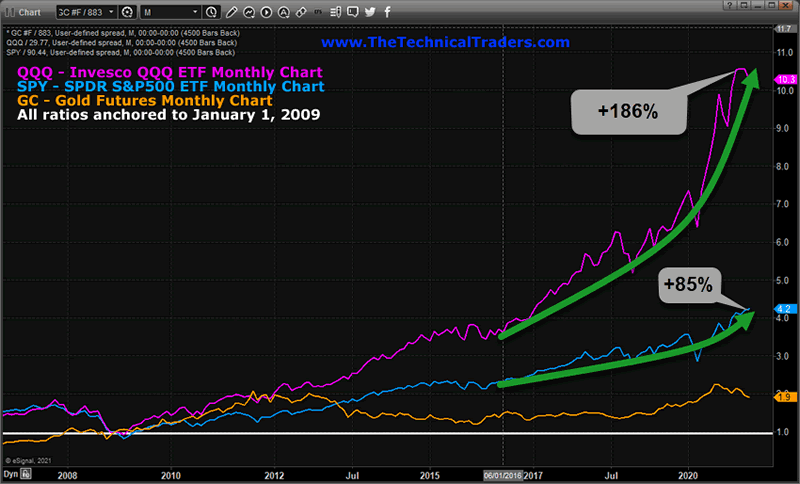
The following Monthly ratio chart, comparing the growth in the QQQ, SPY, and GOLD since January 1, 2009 (the anchor price) highlights how the frenzy of investing really started to accelerate after 2012 and began to move into a parabolic trend in 2016. If you follow the MAGENTA QQQ ratio after the vertical dateline on this chart, you will see how early 2017 started a dramatic acceleration in volatility and trending as the QQQ accelerated higher by more than +186%. Meanwhile, the SPY, which was somewhat overlooked throughout this rally phase, moved higher by only +85%.
Where is the Consumer? Has The Consumer Really Retreated Because Of COVID-19?
One prime example of this frenzy is this recent Yahoo! Finance story about burned Banksy Art which sold for over $390,000 as a Non-Fungible Token. The idea that anyone would buy a burned piece of art for this price shows that money has turned into a game for some people. The gamification of wealth has likely transitioned into global social thinking in ways that we have not even considered yet.
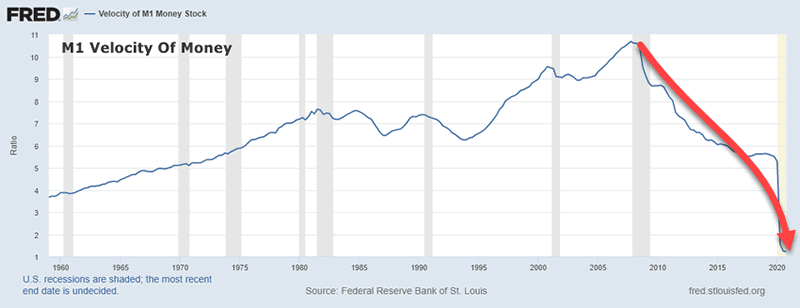
Even though we’ve highlighted how the global equity/financial markets have rallied considerably over the past 5+ years, we still need to see the consumer reenter the economy in a more traditional sense. This M1 Velocity of Money chart shows that after the 2009 peak, the velocity of money, the rate at which money is exchanged within an economy, has collapsed to levels we have not seen in 60+ years, and quite possibly below levels relative to the Great Depression (1930s).
So, what’s happening in the world right now to present these types of charts/data? How can the world be flush with capital/cash and the data show that the consumer is still actively engaged in purchasing various items, which include very active engagement in the global equity markets and speculative trading positions, while the M1 Velocity of Money data shows an incredible collapse after COVID-19 hit?
The answer is simple. The US Federal Reserve has pushed more cash into the global economy over the past 10+ years than at any time in history (more than $16 Trillion since 2009). Prior to that date the total amount of capital/debt the US Fed only pushed a total of $10.6 Trillion into the economy over a 40-year time span. There is nearly 3x the total number of US dollars floating around the globe right now than at any time since prior to the 1950s.
Eventually, we are certain that, this extended cash will translate into GDP growth – which will strengthen the Velocity of Money ratio over time. What it will take is for the economy and the consumer to transition into a new form of expansion related to the post-COVID-19/post Technology euphoria that is currently taking place.
Over the next 20 to 30+ years, we are going to see some very big trends in various sectors and commodities. The global central banks have pushed so much capital out into the world that, once it finds its true economic purpose, we believe the function of this capital will be deployed into various economic components in ways we have not even considered yet. New industry, new forms of consumer products, and consumer participation will likely evolve where capital can be put to use to improve the GDP levels. Cryptos may be the start, a stepping stone, toward a much more dynamic solution for how capital is used and deployed within the global marketplace.
Don’t miss the opportunities in the broad market sectors in 2021, which will be an incredible year for traders of the BAN strategy. You can sign up now for my FREE webinar that teaches you how to find, enter, and profit from only those sectors that have the most strength and momentum. Staying ahead of sector trends is going to be key to success in volatile markets.
For those who believe in the power of trading on relative strength, market cycles, and momentum but don’t have the time to do the research every day then my BAN Trader Pro newsletter service does all the work for you with daily market reports, research, and trade alerts. More frequent or experienced traders have been killing it trading options, ETFs, and stocks using my BAN Hotlist ranking the hottest ETFs, which is updated daily for my premium subscribers.
In Part III of this research article, my team and I will continue to explore the future possibilities and make some suggestions as to how you can prepare for these big trends right now. Remember, this is a longer-term outlook of opportunities for traders/investors. The real gains related to this research will come 5 to 10+ years out into the future if you are able to identify how and where capital is being deployed for gains.
Happy trading!
Chris Vermeulen
www.TheTechnicalTraders.com
Chris Vermeulen has been involved in the markets since 1997 and is the founder of Technical Traders Ltd. He is an internationally recognized technical analyst, trader, and is the author of the book: 7 Steps to Win With Logic
Through years of research, trading and helping individual traders around the world. He learned that many traders have great trading ideas, but they lack one thing, they struggle to execute trades in a systematic way for consistent results. Chris helps educate traders with a three-hour video course that can change your trading results for the better.
His mission is to help his clients boost their trading performance while reducing market exposure and portfolio volatility.
He is a regular speaker on HoweStreet.com, and the FinancialSurvivorNetwork radio shows. Chris was also featured on the cover of AmalgaTrader Magazine, and contributes articles to several leading financial hubs like MarketOracle.co.uk
Disclaimer: Nothing in this report should be construed as a solicitation to buy or sell any securities mentioned. Technical Traders Ltd., its owners and the author of this report are not registered broker-dealers or financial advisors. Before investing in any securities, you should consult with your financial advisor and a registered broker-dealer. Never make an investment based solely on what you read in an online or printed report, including this report, especially if the investment involves a small, thinly-traded company that isn’t well known. Technical Traders Ltd. and the author of this report has been paid by Cardiff Energy Corp. In addition, the author owns shares of Cardiff Energy Corp. and would also benefit from volume and price appreciation of its stock. The information provided here within should not be construed as a financial analysis but rather as an advertisement. The author’s views and opinions regarding the companies featured in reports are his own views and are based on information that he has researched independently and has received, which the author assumes to be reliable. Technical Traders Ltd. and the author of this report do not guarantee the accuracy, completeness, or usefulness of any content of this report, nor its fitness for any particular purpose. Lastly, the author does not guarantee that any of the companies mentioned in the reports will perform as expected, and any comparisons made to other companies may not be valid or come into effect.
Chris Vermeulen Archive |
© 2005-2022 http://www.MarketOracle.co.uk - The Market Oracle is a FREE Daily Financial Markets Analysis & Forecasting online publication.