


Technical Analysis of EUR/USD
Currencies / Euro Feb 20, 2021 - 02:03 PM GMTBy: Submissions

The strength in US long-term yields is beginning to put downward pressure on the Euro as the dollar gains traction. The exchange rate is starting to edge through a critical support level, while the exchange rate is also oversold. Medium-term momentum remains negative, pointing to a lower exchange rate on the EUR/USD. The EUR/USD weekly forex trading chart shows that the currency pair topped out in January and appears to have broken through trend line support. The daily charts show a similar picture but also show that the exchange rate is oversold an might have moved too far too fast.
The Exchange Rate Tops Out in January
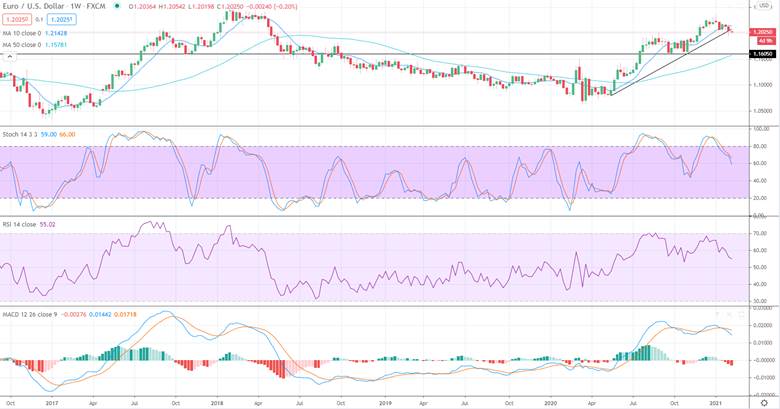
In January of 2021, the EUR/USD hit a 31-month high, which seems to be a top in hindsight. The exchange rate has since declined toward support levels, near an upward sloping trend line near 1.20. The currency pair broke through this level briefly in late January and is currently trading below former support now resistance at 1.2075. Target support on the currency pair on a weekly chart is the November lows at 1.16. This level coincides with the 50-week moving average, which comes in near the same level. The exchange rate looks poised to test the February lows, making a lower low and continuing to trend lower.
Medium-term momentum on the EUR/USD is negative on a weekly chart. The AMCD (moving average convergence divergence) index generated a crossover sell signal. This scenario occurs as the MACD line (the 12-week moving average minus the 26-week moving average) crosses below the MACD signal line. The MACD histogram also generated a crossover sell signal slicing through the zero-index level. The MACD histogram is printing in negative territory with a declining trajectory, which points to lower prices.
In January, the fast stochastic generated a crossover sell signal in overbought territory. The reading on the fast stochastic when it made the crossover sell signal was 91, well above the overbought trigger level of 80. The fast stochastic continues to accelerate lower, reflecting rising negative momentum.
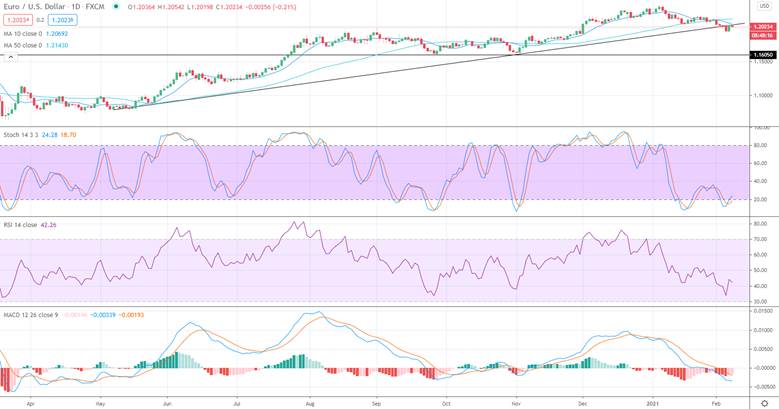
The daily chart of the EUR/USD is similar. The exchange rate has broken down through trend line support. The 10-day moving average has crossed below the 50-day moving average, which means a medium-term downtrend is now in place.
The daily chart shows that the exchange rate is oversold. The fast stochastic generated a crossover sell signal in oversold territory. The current reading on the fast stochastic is 24, up from a low of 12, reflecting accelerating positive momentum. The relative strength index (RSI) also rebounded sharply in February after heading south in January. This movment also reflects the deceleration of negative momentum. Medium-term daily momentum as reflected by the MACD is negative. The daily MACD histogram is printing in negative territory with a downward sloping trajectory, which points to a lower exchange rate on the EUR/USD.
Summary
The EUR/USD looks like it topped out in January and is trendling lower. Its pierced through trend line support and is poised to test the November 2020 lows at 1.16. Weekly momentum is negative, while daily momentum is mixed. The EUR/USD exchange rate is oversold, and could temporarily rebound following a crossover buy signal generated by the fast stochastic. The daily trend is negative as a moving average crossover points to a negative trend. The technicals point to a lower exchange rate, as as US yields gains traction. The US 10-year yield has hit its highest levels since March of 2020. The dollar is likely to continue to rise against most major currencies putting downward pressure on the EUR/USD.
By S N Chatterjee
Copyright 2021 © S N Chatterjee - All Rights Reserved
Disclaimer: The above is a matter of opinion provided for general information purposes only and is not intended as investment advice. Information and analysis above are derived from sources and utilising methods believed to be reliable, but we cannot accept responsibility for any losses you may incur as a result of this analysis. Individuals should consult with their personal financial advisors.
© 2005-2022 http://www.MarketOracle.co.uk - The Market Oracle is a FREE Daily Financial Markets Analysis & Forecasting online publication.