


AI Tech Stocks Buying Levels and EC Indicator Explained
Companies / Investing 2020 Dec 26, 2020 - 07:20 PM GMTBy: Nadeem_Walayat

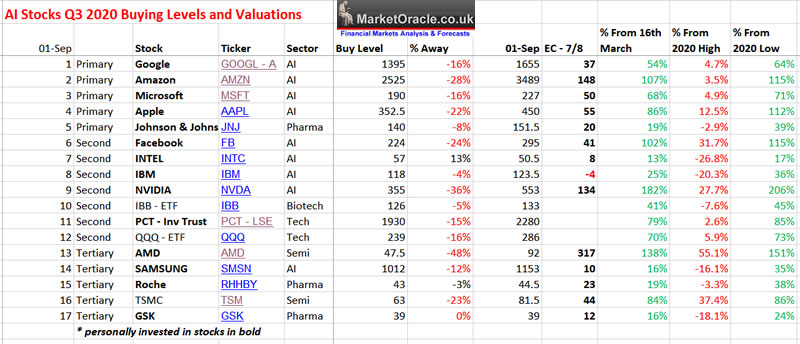
My last look at AI stocks buying levels early September had some of the must own AI stocks trading at ridiculously high valuations for instance Amazon was trading on an EC of 148 against a target maximum of 100! Which prompted me to HIT the SELL button on over 50% of my holdings despite the promise of huge gains in revenues as the pandemic sales and profits came in.
Firstly what are buying levels?
Buying levels are high probability technical levels that a stock 'could' trade down to during a correction i.e. it's an achievable technical chart level that could be used to for instance to put in buy limit orders at just above the buying level if one is looking to accumulate more stock in any particular company i.e. the Buying Level for Google (Alphabet) was $1395, so a limit order at $1395 or higher would be the objective depending on how eager one is to gain exposure to the stock i.e. If I really wanted to buy more Google then the limit order would be OVER $1400 as stocks tend to find support at round numbers.
Stocks Expensive or Cheap Indicator (EC)
This basically condenses down some 12 financial indicators I track for most stocks to determine if they are expensive or cheap (EC), as stock prices are usually not a good indicator of value.
At it's most basic the higher the number the more expensive a stock is and conversely the lower the number the cheaper a stock is. Where a reading of 20-60 tends to be the sweet spot for most AI stocks as it implies earnings growth coupled with sustainable speculative interest and thus results in good trending charts with support during corrections, where value tends to be fair so as to enable one to accumulate stock.
Whilst readings above 60 increasingly indicate high levels of speculative interest in future earnings growth. However, this does not automatically mean that a stock trading over 60 should not be bought or sold, it just means that there is a lot of speculative interest in that stock so expect greater price volatility as investors are more likely to react to news events. So I would still invest in a stocks trading over 60 if they have a good reason to justify such speculative interest i.e. such as AMD and Nvidia as being higher risk stocks. Or Amazon of a say 6 months ago that was set to greatly profit from covid-19 lockdown's.
Over 100 is where stocks are becoming a bit to hot to handle where holding let alone buying depends on understanding what's in the pipeline, what it is driving the stocks into the stratospheric valuations such as AMD first killing Intel and now giving Nvidia a run for it's money. Whilst there will be some such as Amazon, I can't quite fathom the high valuation hence reduce my exposure to.
Whilst readings Under 20 suggests little speculative interest to drive stock prices significantly higher, so likely to expect trading ranges and thus tend to be sleeping giants in the AI mega-trend. Also could be signaling problems with the stocks i.e. such as Intel losing the CPU war to AMD which has has made Intel a disliked stock to hold whilst AMD has been heavily bid up into fever making it an expensive buy.
AI Tech Stocks Buying Levels and Valuations for Q4 2020
The rest of this analysis has first been made available to Patrons who support my work so immediate first access to ALL of my analysis and trend forecasts then do consider becoming a Patron by supporting my work for just $3 per month. https://www.patreon.com/Nadeem_Walayat.
AI Stocks Portfolio Buying Levels Q4 2020 Analysis
- US Presidential Election 2020 Forecast Review
- Seeing Stock Market New Highs Through the Prism of AI
- Stock Market Dow Quick Take
- AI Stocks Buying Levels and EC ratio Explained
- Top 10 AI Stocks individual analysis i.e. for Google, Amazon, Apple etc.
- AI Stocks Buying Levels Q4 2020
- The Next IMMINENT Global Catastrophe After Coronavirus
And ensure you are subscribed to my ALWAYS FREE newsletter for my next in-depth analysis.

Nadeem Walayat
Copyright © 2005-2020 Marketoracle.co.uk (Market Oracle Ltd). All rights reserved.
Nadeem Walayat has over 30 years experience of trading derivatives, portfolio management and analysing the financial markets, including one of few who both anticipated and Beat the 1987 Crash. Nadeem's forward looking analysis focuses on UK inflation, economy, interest rates and housing market. He is the author of five ebook's in the The Inflation Mega-Trend and Stocks Stealth Bull Market series that can be downloaded for Free.


 Nadeem is the Editor of The Market Oracle, a FREE Daily Financial Markets Analysis & Forecasting online publication that presents in-depth analysis from over 1000 experienced analysts on a range of views of the probable direction of the financial markets, thus enabling our readers to arrive at an informed opinion on future market direction. http://www.marketoracle.co.uk
Disclaimer: The above is a matter of opinion provided for general information purposes only and is not intended as investment advice. Information and analysis above are derived from sources and utilising methods believed to be reliable, but we cannot accept responsibility for any trading losses you may incur as a result of this analysis. Individuals should consult with their personal financial advisors before engaging in any trading activities.
Nadeem Walayat Archive |
© 2005-2022 http://www.MarketOracle.co.uk - The Market Oracle is a FREE Daily Financial Markets Analysis & Forecasting online publication.