


Gold Price Momentous ally From 2000 Compared To SPY Stock Market and Nasdaq
Commodities / Gold & Silver 2020 Nov 17, 2020 - 04:49 PM GMTBy: Chris_Vermeulen

In Part I of this research article I highlighted the incredible rally in Gold related to a 2020 Anchor point and how that rally in Gold compared to the QQQ and SPY. In this second Part I am going to highlight the price appreciation in the QQQ and SPY in comparison to Gold since 2009. It is important to understand how the equities/stocks have rallied in comparison to Gold because the ratio of valuation levels in equities/stocks compared to Gold appears to show when price disparities become outrageous and begin to revert.
Part I of our research showed the 2000 anchor point ratios, where we saw that Gold appreciated faster than the QQQ and the SPY over the span of the past 20 years. You’ll also see that the QQQ and SPY have appreciated very quickly over the past 5+ years in an attempt to close the gap. This represents a shift in how traders view opportunities in different asset classes.
9 to 9.5 year Gold Depreciation Cycle Ended in 2018 – what next?
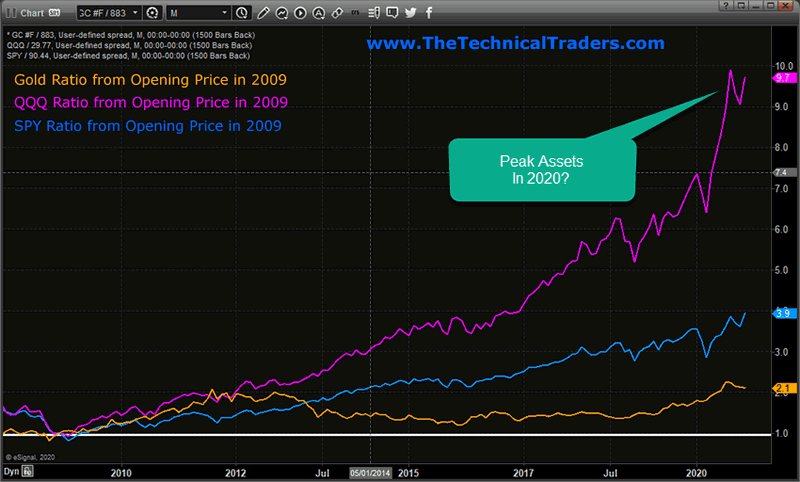
We will now shift the anchor point to January 1, 2009, to see how the markets have reacted to valuations since the downturn created by the Global Financial Crisis. The starting point is to determine how Gold, the QQQ, and the SPY have rallied since this major event in the global markets, and at what ratio. Ideally, we would have seen moderately uniform appreciation ratios over the past 10 years. This would mean that traders placed nearly equal enthusiasm for higher valuations in the QQQ, SPY, and Gold. As we will see below, this is not the case.
Taking a look at this first Monthly 2009 Anchor ratio chart below, we see the QQQ is the big winner with a current ratio level above 9.0. This suggests that the QQQ has rallied over 900% since the January 1, 2009 anchor price. The SPY has rallied to current levels near 3.9. This suggests that the SPY has rallied over 390% since the January 1, 2009 anchor point price levels. Gold has only rallied to levels near 2.1 on this chart. This suggests that Gold has been ignored as an asset class and has failed to keep up with the rally in the QQQ and the SPY over the past 10+ years.
This chart also suggests that traders focused more on the appreciation and expectations related to the NASDAQ/Technology sector over the past 4+ years as a source of asset growth. Companies like Amazon, Facebook, Netflix, Microsoft, and others became the “hot symbols” while the SPY and Gold fell away from investors’ focus. This has happened before in the late 1990s with the DOT COM rally. Traders and speculators jumped in on what appears to be a never-ending rally in the technology sector only to be shocked by the eventual collapse of that sector in early 2000. Could the same thing happen again?
THE DOT COM DAYS ALL OVER AGAIN?
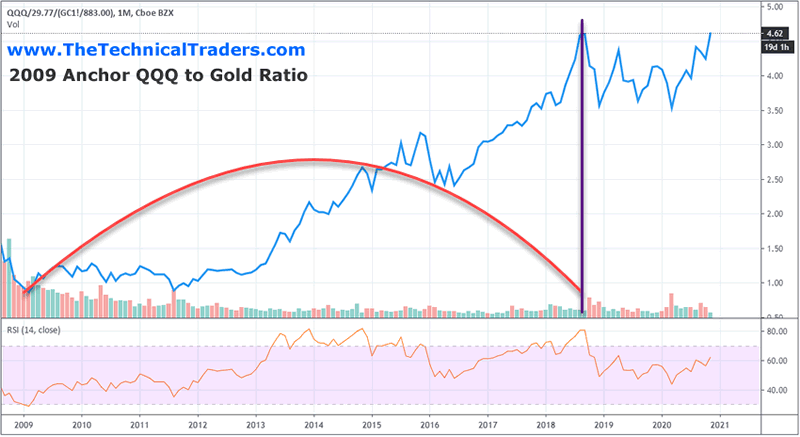
If we were to take a look at a different perspective of this same data in the chart below, using the January 1, 2009 date as an anchor point, the rally in the QQQ compared to the recent rally in Gold takes on a completely different perspective. This chart shows the appreciation of the QQQ compared to Gold since 2009 has rallied more than 4.60 (460%). The price of Gold on January 1, 2009, was 883.00 and the current price of Gold is $1875.80. The price of the QQQ on January 1, 2009, was 29.77 and the current price of the QQQ is 288.40. This suggests that the QQQ rallied 460% higher than the rally in Gold over this span of time.
This raises an interesting point that the current rally in the QQQ is similar to the extreme highs we saw in early 2000 near the DOT COM peak. Even though, on the 2000 anchor ratio chart, the QQQ ratio seems small compared to the 2000 anchor levels, the 2009 anchor ratio chart shows a different rate of appreciation based on the January 1, 2009 anchor point. The biggest difference is the relationship between the origination points (being near the Global Financial Crisis lows) and the bigger rally in the QQQ compared to the rally in Gold. What this suggests is that the QQQ has rallied much more extensively than Gold over the past 11 years – which is very similar to the DOT COM rally peak.
A PRECIOUS METALS APPRECIATION PHASE HAS BEGUN
When we take into consideration the 9 to 9.5 year cycles that my research team and I believe represent appreciation/depreciation cycles, we begin to understand that Gold has under-appreciated over the span of time from 2009 to 2018 and that the new cycle of Precious Metals appreciation has just started in 2019. If our cycle research is correct, this new phase of precious metals appreciation will last until 2028 or so – very likely driving metals prices much higher to close the ratio gap shown on this chart.
We expect the ratio level to fall to levels near 1.60 to 2.50 over the next few years (possibly lower) as the price of Gold rallies faster than the price of the QQQ. Over time, the QQQ may continue to still appreciate in some form, but that would suggest that Gold would still continue to appreciate at a faster rate to close the gap in the ratio level.
We believe the key ratio high level, shown on the chart above with a dark blue vertical line, may be the valuations peak (at least for now). It aligns with our cycle interpretation and suggests that the late stage rally in the QQQ from mid-2018 may be a speculative exhaustion rally. As the QQQ and SPY stay near all-time highs and Gold fails to advance substantially higher, this ratio will not change very much from the current levels.
Take a look at the 2000 Anchor QQQ to Gold Ratio chart from Part I of this research article. The ratio levels did not start to change until the QQQ and SPY has clearly started to decline in late 2000 to early 2001 and when Gold started to move moderately higher. Remember, Gold did not really start to break higher and start a real uptrend until after 2003/04 – this is when we start to see the ratio decline at a faster rate.
Before you continue, be sure to opt-in to our free market trend signals before closing this page, so you don’t miss our next special report!
Currently, with Gold trading near 1892 and the QQQ and SPY trading near all-time highs, our researchers believe we are very close to a peak in the equities/stock market based on these ratios. We also believe the 2009 Anchor chart ratio would have to fall below 3.5 to initiate a new “change of trend” trigger based on our research. The current volatility in the markets suggests we will likely see a very wide range of price rotation before any new trends are established (up or down). But we do see similarities in the current setup compared to the 2000 setup in terms of how the QQQ and SPY have reached lofty ratio levels while Gold has stalled near a base/momentum level.
Should our interpretations turn out to be accurate, we would start to see Gold appreciate higher at a faster rate over the next 2 to 3+ years while the QQQ and SPY potentially enter a moderately sideways or downward price trend (possibly somewhat similar to the 2000 to 2006 QQQ price rotation).
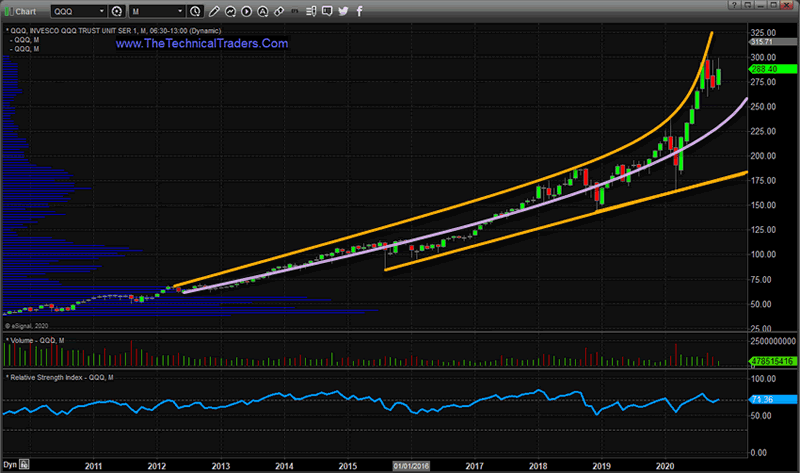
The QQQ Monthly chart below highlights the incredible parabolic upside price trend that has initiated in early 2020 and how price has extended upward at almost extreme rates on expectations and speculation. We believe any breakdown of this trend may prompt another 2000~2004 type of sideways market correction resulting in a reversion of the ratios we’ve highlighted in the charts above. Any downside rotation in the QQQ to levels below 252 will likely breach the middle channel level of this recent parabolic upside price trend and result in the start of the reversion event.
The US elections, new policies and pending US economic shutdown (possibly for 30 to 60+ days as suggested by Joe Biden’s team) will shock the markets if it happens. We are not fortune-tellers and are not able to clearly see what will happen in the future, but we can tell from the ratio charts and the QQQ chart, above, that very heavy price speculation has driven the markets into an upside rally mode and we are concerned above “how and when” it ends. It may be that the rally continues for a number of years – or it may already be nearing an end. Our researchers believe the peak level in 2018 on our ratio chart, after the last 9 to 9.5 year cycle completed, is showing us that the upward price cycle has already likely ended and we are transitioning into a renewed Precious Metals/Gold appreciation phase.
Imagine how powerful it would be for you to be able to trade only the strongest and best-performing assets across the spectrum while being able to take advantage of technical patterns and multiple re-entry triggers. If you want to learn how we can help you find and identify great trading opportunities, then please visit www.TheTechnicalTraders.com to learn about my proprietary trading systems using my exciting ”Best Asset Now” strategy and indicators. You can also sign up for my daily pre-market video reports that walks you through the charts of all the major asset classes every morning.
Chris Vermeulen
www.TheTechnicalTraders.com
Chris Vermeulen has been involved in the markets since 1997 and is the founder of Technical Traders Ltd. He is an internationally recognized technical analyst, trader, and is the author of the book: 7 Steps to Win With Logic
Through years of research, trading and helping individual traders around the world. He learned that many traders have great trading ideas, but they lack one thing, they struggle to execute trades in a systematic way for consistent results. Chris helps educate traders with a three-hour video course that can change your trading results for the better.
His mission is to help his clients boost their trading performance while reducing market exposure and portfolio volatility.
He is a regular speaker on HoweStreet.com, and the FinancialSurvivorNetwork radio shows. Chris was also featured on the cover of AmalgaTrader Magazine, and contributes articles to several leading financial hubs like MarketOracle.co.uk
Disclaimer: Nothing in this report should be construed as a solicitation to buy or sell any securities mentioned. Technical Traders Ltd., its owners and the author of this report are not registered broker-dealers or financial advisors. Before investing in any securities, you should consult with your financial advisor and a registered broker-dealer. Never make an investment based solely on what you read in an online or printed report, including this report, especially if the investment involves a small, thinly-traded company that isn’t well known. Technical Traders Ltd. and the author of this report has been paid by Cardiff Energy Corp. In addition, the author owns shares of Cardiff Energy Corp. and would also benefit from volume and price appreciation of its stock. The information provided here within should not be construed as a financial analysis but rather as an advertisement. The author’s views and opinions regarding the companies featured in reports are his own views and are based on information that he has researched independently and has received, which the author assumes to be reliable. Technical Traders Ltd. and the author of this report do not guarantee the accuracy, completeness, or usefulness of any content of this report, nor its fitness for any particular purpose. Lastly, the author does not guarantee that any of the companies mentioned in the reports will perform as expected, and any comparisons made to other companies may not be valid or come into effect.
Chris Vermeulen Archive |
© 2005-2022 http://www.MarketOracle.co.uk - The Market Oracle is a FREE Daily Financial Markets Analysis & Forecasting online publication.