


Stock Market Spy ETF Testing March Price Peak – What Do the Charts Say?
Stock-Markets / Stock Markets 2020 Oct 08, 2020 - 05:17 PM GMTBy: Chris_Vermeulen

RESEARCH HIGHLIGHTS:
- The SPY has been trading below its previous peak resistance level from March for more than two weeks and has begun to retest this level.
- If the SPY can clear this level on moderately strong volume, we believe the US stock market may enter another “melt-up” phase.
- If not, then we may see more of a sideways/melt-down phase headed into the US Presidential Elections.
The SPY, SPDR S&P 500 ETF, has been trading below the $339.50, previous peak resistance level, for more than two weeks recently and has begun to retest this level. I believe these levels are critical in determining the future trending capacity of the SPY and the US stock market. If the SPY can clear this level on moderately strong volume, we believe the US stock market may enter another “melt-up” phase. If not, then we may see more of a sideways/melt-down phase headed into the US Presidential Elections.
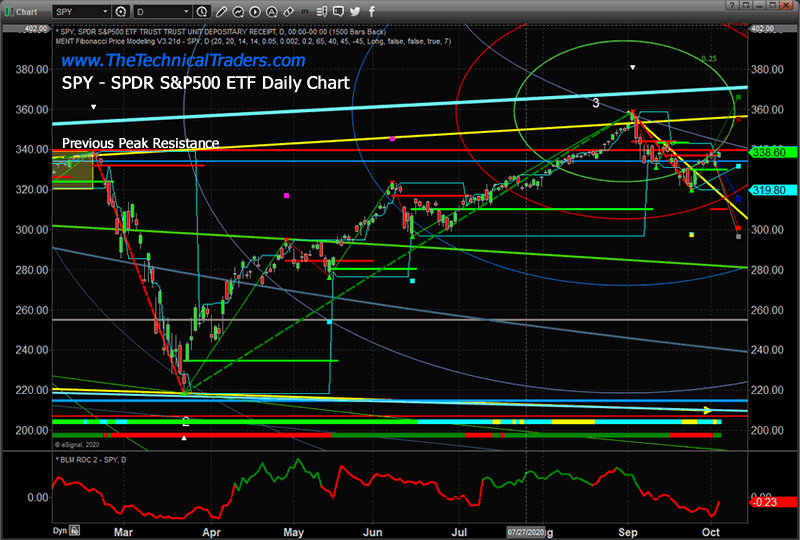
SPY PRICE RESISTANCE AT $339.50
This Daily SPY chart below highlights our Adaptive Fibonacci Price Modeling system and shows the Previous Peak Resistance level as a SOLID RED LINE. We believe the current setup suggests this resistance level may act as a solid ceiling in price over the next few weeks. If price can break through this resistance level for a few trading sessions then we will likely see it continue marching up (until the next news bomb hits).
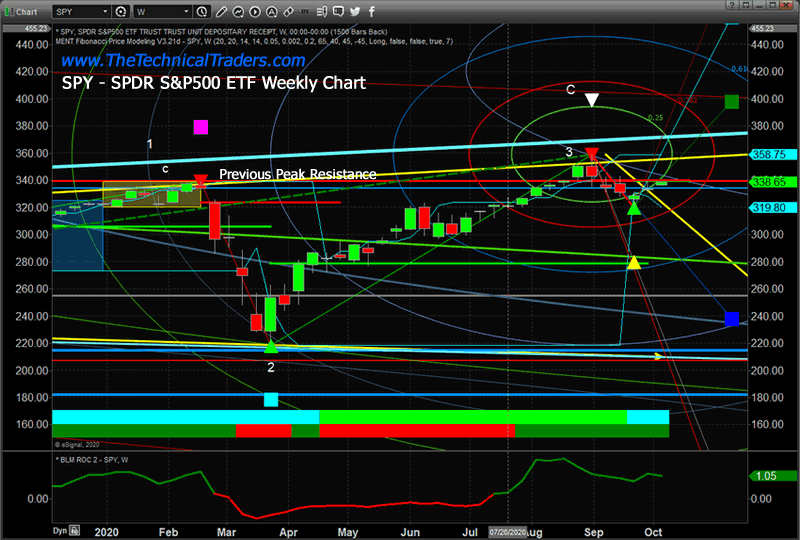
Below, we look at the Weekly SPY chart to see the bigger picture with a longer-term chart. We can easily spot the resistance near the $339.50 previous peak level and how the current price is retesting this critical price level. We believe the markets are simply waffling sideways before the US Presidential elections.
Watch for the $339.50 level to be accepted or rejected. Traders should stay very cautious and look for sectors that present greater opportunities and defined trends. The major indexes are going to continue to trade in a sideways pattern as Washington DC and the Senate are stuck in paralysis before the elections. There are still opportunities to profit from some of these moves, just be cautious of the volatility at play in the markets.
As a technical analyst and trader since 1997, I have been through a few bull/bear market cycles in stocks and commodities. I believe I have a good pulse on the market and timing key turning points for investing and short-term swing traders. Subscribers of my Active ETF Swing Trading Newsletter can ride my coattails as I navigate these financial markets and build wealth. My research and trading team are here to help you find better trades and navigate these incredibly crazy market trends.
While most of us have active trading accounts, our long-term investment and retirement accounts are equally at risk. We can also help you preserve and even grow your long term capital when things get ugly (likely now) with our Passive Long-Term ETF Investing Signals. Don’t wait until it is too late – subscribe today!
Chris Vermeulen
www.TheTechnicalTraders.com
Chris Vermeulen has been involved in the markets since 1997 and is the founder of Technical Traders Ltd. He is an internationally recognized technical analyst, trader, and is the author of the book: 7 Steps to Win With Logic
Through years of research, trading and helping individual traders around the world. He learned that many traders have great trading ideas, but they lack one thing, they struggle to execute trades in a systematic way for consistent results. Chris helps educate traders with a three-hour video course that can change your trading results for the better.
His mission is to help his clients boost their trading performance while reducing market exposure and portfolio volatility.
He is a regular speaker on HoweStreet.com, and the FinancialSurvivorNetwork radio shows. Chris was also featured on the cover of AmalgaTrader Magazine, and contributes articles to several leading financial hubs like MarketOracle.co.uk
Disclaimer: Nothing in this report should be construed as a solicitation to buy or sell any securities mentioned. Technical Traders Ltd., its owners and the author of this report are not registered broker-dealers or financial advisors. Before investing in any securities, you should consult with your financial advisor and a registered broker-dealer. Never make an investment based solely on what you read in an online or printed report, including this report, especially if the investment involves a small, thinly-traded company that isn’t well known. Technical Traders Ltd. and the author of this report has been paid by Cardiff Energy Corp. In addition, the author owns shares of Cardiff Energy Corp. and would also benefit from volume and price appreciation of its stock. The information provided here within should not be construed as a financial analysis but rather as an advertisement. The author’s views and opinions regarding the companies featured in reports are his own views and are based on information that he has researched independently and has received, which the author assumes to be reliable. Technical Traders Ltd. and the author of this report do not guarantee the accuracy, completeness, or usefulness of any content of this report, nor its fitness for any particular purpose. Lastly, the author does not guarantee that any of the companies mentioned in the reports will perform as expected, and any comparisons made to other companies may not be valid or come into effect.
Chris Vermeulen Archive |
© 2005-2022 http://www.MarketOracle.co.uk - The Market Oracle is a FREE Daily Financial Markets Analysis & Forecasting online publication.