


To US $50 Trillion Debt (and Beyond)
Interest-Rates / US Debt Oct 05, 2020 - 02:46 PM GMTBy: John_Mauldin

In my 2020 forecast letters, published in January as the pandemic was just gaining attention, I noted this:
"When we do have a recession, which again I point out is likely to be after the election (the only meaningful data point between now and the end of next year), the deficit will explode to over $2 trillion per year and, without meaningful reform, never look back. That puts US debt at $35 trillion+ by the end of 2029."
According to CBO, this deficit -- which I said optimistically, in hindsight, would be over $2 trillion in a recession year -- will be more like $3.3 trillion.
What does this do to the national debt? First, we have to define some terms.
You’ll often see numbers for “debt held by the public” or something similar. These exclude amounts the government owes to internal entities like the Social Security trust funds, military pensions, and other “we owe it to ourselves”-type funds.
Those trust funds are running down at some point, and those bonds will have to be repaid or sold into the market just like any other form of government debt.
There is no such thing as owing it to ourselves. Not in the real world. It sounds good if you’re a politician trying to ignore or minimize debt. This ostrich-like head in the sand approach courts disaster.
“Total Public Debt” is more inclusive, and at the end of FY 2019 it was approximately $23.2 trillion. If the latest CBO estimate is correct, FY 2020 ends with it well over $26 trillion.
If we plug that into CBO’s revenue and spending estimates through 2030, we get something like this.
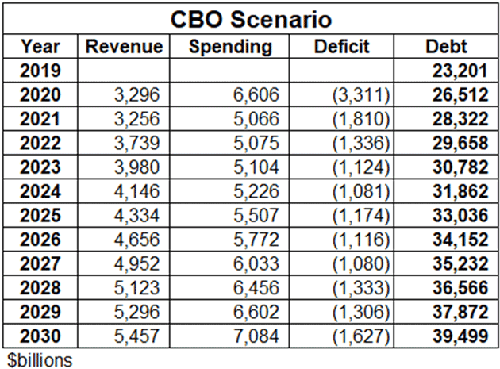
Note again, this is the official CBO data. You don’t often see it this way because they usually express it as a percentage of GDP instead of raw dollars.
The CBO's own numbers now show an almost $38 trillion debt at the end of 2029. That's far more than the also-alarming $35 trillion I estimated earlier this year.
Yet, the CBO is optimistic. Some very slight and quite reasonable adjustments show the debt will be trillions higher by 2030. Below is the same table again with three changes:
- We reset revenue to change by the same annual percentages it did in 2008 and the following recession and post-recession years. That actually raises 2020 revenue a bit, after which it drops considerably lower than the CBO estimates.
- We take CBO’s spending projections and add 2% to each year. This I think is a fair and maybe even conservative expectation.
- We add $269 billion in yearly off-budget spending, which is the average since 2000. (You can take almost any 10-year period out of the last 20 and get close to that $269 billion average. Some years it has over $500 billion and some years it is negative. But the average is eerily consistent.)
Everything other than the above three changes is the same. When I asked my colleague Patrick Watson to make those assumptions for the next table, we both knew that it would increase the total debt.
Here is the result:
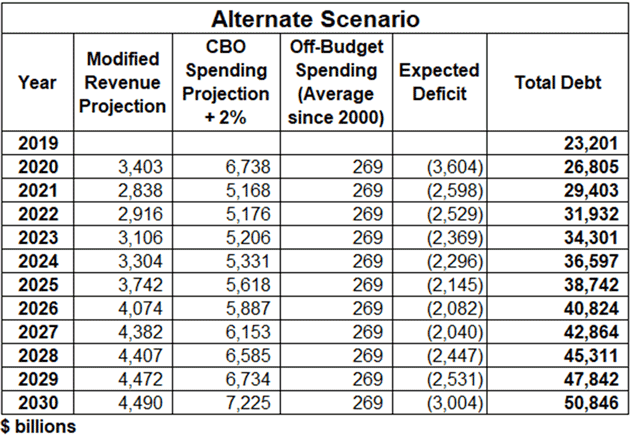
Under these (more likely) assumptions, the debt will breach $50 trillion in 2030.
I bet it happens even sooner, because we probably won’t get through the 2020s without some other event blowing out the numbers—another recession or pandemic, an expensive war, who knows.
But history suggests something will occur, with significant fiscal effect.
Here is that $50 trillion in a simple line graph:

“Turning Japanese, I think we’re turning Japanese, I really think so.”
The CBO projections follow the government’s fiscal year, running from October 1 to the end of September. It is projecting a deficit of a little over $3.3 trillion for fiscal 2020.
Note that the CBO can only project current law. I expect House Speaker Nancy Pelosi and President Trump will agree to a “Phase IV” economic relief package well north of $2 trillion.
As I wrote recently about the stall speed economy, without another relief package, the economy will fall into a depression by the end of the year. Neither party wants that.
But that means adding another $2 trillion to the 2021 deficit, pushing it over $4 trillion.
From $4 Trillion to $40 Trillion in Under a Decade
Here is where the wonderful U.S. Debt Clock says we are today:
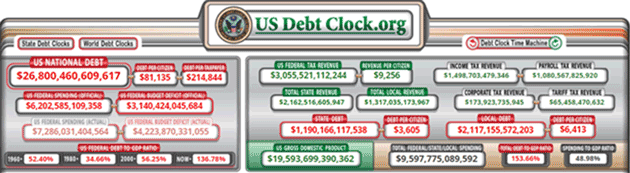
You can click on any of the numbers at that website for an explanation and sometimes deeper links. This is just a small section. It tracks almost everything. On the left-hand side of the visual above, the third set of boxes show actual US federal spending and the budget deficit. When you click on the box labeled “U.S. Federal Budget Deficit (Actual),” the definition includes off-budget spending.
They project over $1 trillion in off-budget spending this year. Ouch! And they are not including the $2 trillion Phase IV relief package, either.
We are so going to blow through $30 trillion total debt sometime early next year, making my milder projections wildly wrong.
Just a year ago, I naïvely expected it would be 2025 before we got to $30 trillion, and we would be short of $40 trillion by 2030.
Add an additional $2 trillion in Phase IV, and the debt will easily be $40 trillion by 2025 … and $50 trillion before the end of the decade.
How Will We Finance All That Debt?
Americans and a shrinking group of foreign investors have been surprisingly willing to buy as much paper as Washington can print. That's even with near zero (or below zero, adjusted for inflation) interest rates.
But there are limits, at least in theory. Those may draw closer if the global recession drags on.
The most obvious solution is for the Fed to buy whatever amount of bonds Treasury needs to sell using quantitative easing. Fed Chairman Jerome Powell is definitely willing.
Depending on how the Fed disposes of its bonds, it might be the practical equivalent of modern monetary theory (MMT). And the Fed’s willingness will not be lost on a future Congress, which could easily decide to test the limit. That $50 trillion could just be the start.
Financing it aside, the other question is what effect all this federal debt will have on private markets. Will it have a “crowding out” effect that reduces private lending? How will it affect legitimate business and investment activity?
We’ll see the result in lower growth.
Remember, we aren’t just talking about federal debt. States and local governments owe over $3 trillion more, plus trillions more in unfunded state pension liabilities -- some of which could easily end up at the Fed or Treasury.
Then there are the wildly underfunded pensions (both government and corporate) that could easily default and force some kind of federal takeover. Plus corporate bonds, mortgages, student loans, auto loans, SBA loans could make my $50 trillion projection prove way too optimistic.
You may be a debt-free, prudent investor. But we are collectively in hock up to our ears.
As citizens and taxpayers, some of this will end up on our shoulders. Not a pleasant thought? Exactly. Which is why I expect a Great Reset.
A real economist would probably call it Debt Rationalization. We will reach a point where it becomes the least-bad alternative.
The Great Reset: The Collapse of the Biggest Bubble in History
New York Times best seller and renowned financial expert John Mauldin predicts an unprecedented financial crisis that could be triggered in the next five years. Most investors seem completely unaware of the relentless pressure that’s building right now. Learn more here.
Disclaimer: The above is a matter of opinion provided for general information purposes only and is not intended as investment advice. Information and analysis above are derived from sources and utilising methods believed to be reliable, but we cannot accept responsibility for any losses you may incur as a result of this analysis. Individuals should consult with their personal financial advisors.
John Mauldin Archive |
© 2005-2022 http://www.MarketOracle.co.uk - The Market Oracle is a FREE Daily Financial Markets Analysis & Forecasting online publication.