


Our Proprietary ADL US Markets Forecasts
Stock-Markets / Financial Markets 2020 Aug 19, 2020 - 03:27 PM GMTBy: Chris_Vermeulen

Our friends and followers love it when we publish and Adaptive Dynamic Learning (ADL) predictive modeling chart. These are very special charts because they show us what our proprietary predictive modeling system is suggesting is a likely outcome many weeks or months into the future. We wanted to highlight the YM ADL chart, below, because we published it near the end of 2019 in a research article suggesting a deep price correction was setting up for 2020. Additionally, you should be able to follow the YELLOW ARROWS on the chart to see how and where the ADL predictive modeling system suggested the YM price would target.
This new ADL research, in combination with our other recent research posts, suggests the US stock market may be stalling ahead of the US Presidential elections in a moderate “melt-up” trend. Essentially, this means the upside trend bias will likely stay intact for another 35+ days with moderate volatility (meaning 4% to 8%+ rotational ranges) before peaking sometime in October or very early November 2020.
As we can see from the chart, the likelihood of a deep price decline in the markets before the US election (November 3, 2020) could possibly be related to earnings, news, a “reality-check”, or some other event. The stakes are fairly high for the 2020 US Presidential elections in terms of the future of the US and the world. New policies and leadership could dramatically alter trader/investor expectations.
DOW JONES ADL PREDICTIONS
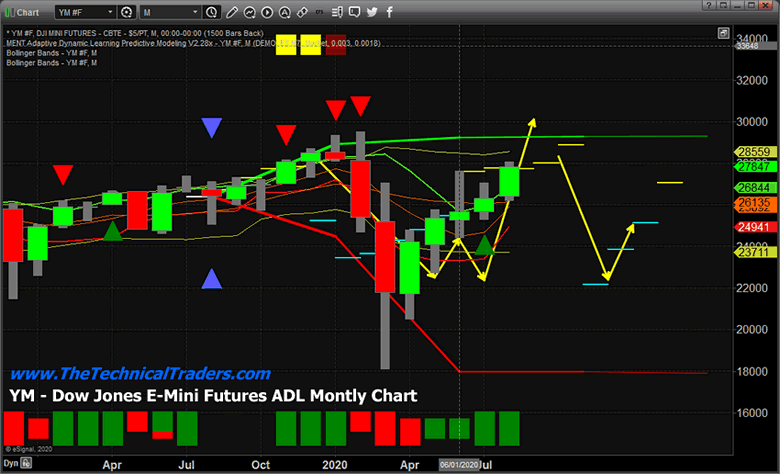
Our ADL predictive modeling system is currently suggesting the YM price activity may seek higher prices over the next 30 to 60 days, yet the huge downside prediction for a price collapse in November/December 2020 is likely related to the US Presidential Election event. This suggests that the US stock market, and major indexes, could enter a period of volatility and sideways congestion over the next 60+ days which ultimately results in another massive breakdown in price near October/November/December 2020.
The ADL predictive modeling system is suggesting an -18% to -24% downside price move should be expected from a peak level in the YM near 28,925. We’ve learned from past experience with the ADL system that price levels may react earlier or later than ADL predictions suggest – but generally the ADL predictions are very accurate. Take a look at the big downside move related to the COVID-19 breakdown in February/March 2020. Even though the ADL predictive modeling system suggested a lower target level near 22,645, the markets actually sold-off to a deeper level near 18,086. The same type of extreme selling could take place in November/December 2020 with this next predicted breakdown.
We believe there is a very real potential for an early topping pattern to setup over the next 30 to 60 days in the US stock market – a rounded or “R-shaped” topping pattern. The ADL predictive modeling system attempts to identify projected future price target levels, but as you can see from the deep price decline in February/March 2020, price can move well beyond the projected ADL target levels – sometimes entering what we call an “anomaly phase”. This is where price moves against the predicted ADL levels in a way that seems counter to expected price reaction.
Before you continue, be sure to opt-in to our free-market trend signalsnow so you don’t miss our next special report!
Please note that sometimes these moves happen when extended momentum carries a rally or selloff beyond an ADL predicted peak or bottom level. Sometimes the markets break higher or lower before the ADL predicted system triggers. The bottom line is that our ADL system is suggesting volatility and a deeper downside price correction will happen within the next 30 to 60 days – prior to the November 2020 elections.
THE BIGGER PICTURE FOR METALS & MARKETS
Attempting to put all of this into a bigger picture conclusion for our friends and followers, we believe the upside price trend in the markets is the dominant trend right now. Given that basis, our ADL predictive modeling system is suggesting the upside price trend will likely end within the next 20 to 30+ days, peaking near 28,925 then immediately entering a big downward price correction. We believe the continue upside price move will be more of a sideways price advance – possibly setting up into a Pennant/Flag type of setup where moderate downside price rotation will create more uncertainty for traders/investors. This will probably not be a fun time for long-side traders as the risk for 4% to 8% rotations in price will be very real.
Still, from a trader’s perspective, this upside price trend, and the bigger downside price move setting up in November/December 2020, presents very real opportunity for huge gains if you know how to time these moves and prepare for the risks. Right now, this market and the profits therein are fantastic opportunities for skilled technical traders. As we suggesting way back in 2018 and 2019, 2020 and 2021 are going to be incredible opportunities for skilled technical traders.
Be sure to read the other research reports we issued recently, especially this week’s research on Gold & Silver price expectations for 2020/2021 and our July 29, 2020 report on other Technical Patterns we see forming in the markets.
Isn’t it time you learned how our research team can help you find and execute better trades? Our incredible technical analysis tools have just shown you what to expect 6+ months into the future. Do you want to learn how to profit from these huge moves? Visit www.TheTechnicalTraders.com to learn how we help thousands of traders take advantage of technical analysis and trade setups.
If you found this informative, then sign up now to get a pre-market video every day before the opening bell that walks you through the charts and my proprietary technical analysis of all of the major assets classes. You will also receive my easy-to-follow ETF swing trades that always include an entry price, a stop, two exit targets, as well as a recommended position sizing. Visit my Active ETF Trading Newsletter to learn more.
While many of you have trading accounts, our most important accounts are long-term buy-and-hold investment accounts. Our signals can help you preserve and even grow your long term capital. If you have any type of long-term investment or retirement account and are looking for signals as to when to own equities, bonds, or cash, be sure to become a member of my Long-Term Investing Signals, which includes a weekly market update and trade alerts.
Chris Vermeulen
www.TheTechnicalTraders.com
Chris Vermeulen has been involved in the markets since 1997 and is the founder of Technical Traders Ltd. He is an internationally recognized technical analyst, trader, and is the author of the book: 7 Steps to Win With Logic
Through years of research, trading and helping individual traders around the world. He learned that many traders have great trading ideas, but they lack one thing, they struggle to execute trades in a systematic way for consistent results. Chris helps educate traders with a three-hour video course that can change your trading results for the better.
His mission is to help his clients boost their trading performance while reducing market exposure and portfolio volatility.
He is a regular speaker on HoweStreet.com, and the FinancialSurvivorNetwork radio shows. Chris was also featured on the cover of AmalgaTrader Magazine, and contributes articles to several leading financial hubs like MarketOracle.co.uk
Disclaimer: Nothing in this report should be construed as a solicitation to buy or sell any securities mentioned. Technical Traders Ltd., its owners and the author of this report are not registered broker-dealers or financial advisors. Before investing in any securities, you should consult with your financial advisor and a registered broker-dealer. Never make an investment based solely on what you read in an online or printed report, including this report, especially if the investment involves a small, thinly-traded company that isn’t well known. Technical Traders Ltd. and the author of this report has been paid by Cardiff Energy Corp. In addition, the author owns shares of Cardiff Energy Corp. and would also benefit from volume and price appreciation of its stock. The information provided here within should not be construed as a financial analysis but rather as an advertisement. The author’s views and opinions regarding the companies featured in reports are his own views and are based on information that he has researched independently and has received, which the author assumes to be reliable. Technical Traders Ltd. and the author of this report do not guarantee the accuracy, completeness, or usefulness of any content of this report, nor its fitness for any particular purpose. Lastly, the author does not guarantee that any of the companies mentioned in the reports will perform as expected, and any comparisons made to other companies may not be valid or come into effect.
Chris Vermeulen Archive |
© 2005-2022 http://www.MarketOracle.co.uk - The Market Oracle is a FREE Daily Financial Markets Analysis & Forecasting online publication.