


NASDAQ Stock Market Double Top & Price Channels Suggest Pending Price Correction
Stock-Markets / Tech Stocks Jul 29, 2020 - 05:03 PM GMTBy: Chris_Vermeulen

Our research team continues to attempt to navigate the difficult market dynamics ahead as traders’ concerns related to continued global economic functions persist. We believe the US stock market has rallied well beyond sustainable levels and the recent move in the US Dollar and Precious Metals has issued a clear warning that global traders are not buying into the current valuation levels of the major indexes. The NASDAQ (NQ) has rallied to new all-time highs at a time when a majority of the US Stock Market is contracting and concerns about future earnings/revenues continue to shock investors. It is almost as if a large group of traders piled into the “Fed Recovery” message and ignored the fact that the COVID-19 virus event is vastly different than any other price correction we’ve experienced over the past 40+ years.
NQ DOUBLE TOP SETUP
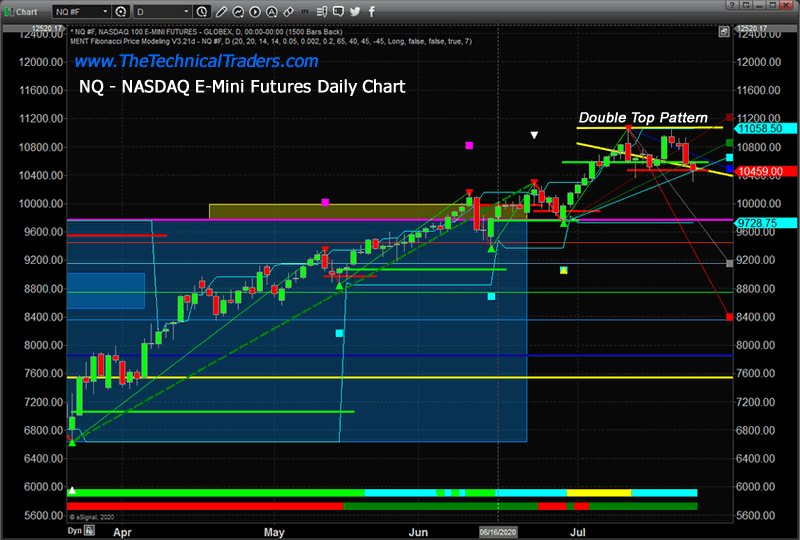
Recently, the NQ setup a very clear Double Top pattern near a somewhat obscure Fibonacci level (85.4%). The Double Top pattern is a common technical pattern that suggests a resistance has formed near the Double Top price level, near 11058.50. Next week, critical GDP data and economic data will be announced on Thursday, July 30. We believe the move in Gold and Silver is foreshadowing an ominous series of data that will reflect a very clear 20% to 30%+ contraction in the US and global economy. The Double Top pattern in the NQ could be a very strong warning that the FOMO (Fear Of Missing Out) rally may be over.
NASDAQ DAILY CHART
NQ 100% MEASURED MOVE SETUP
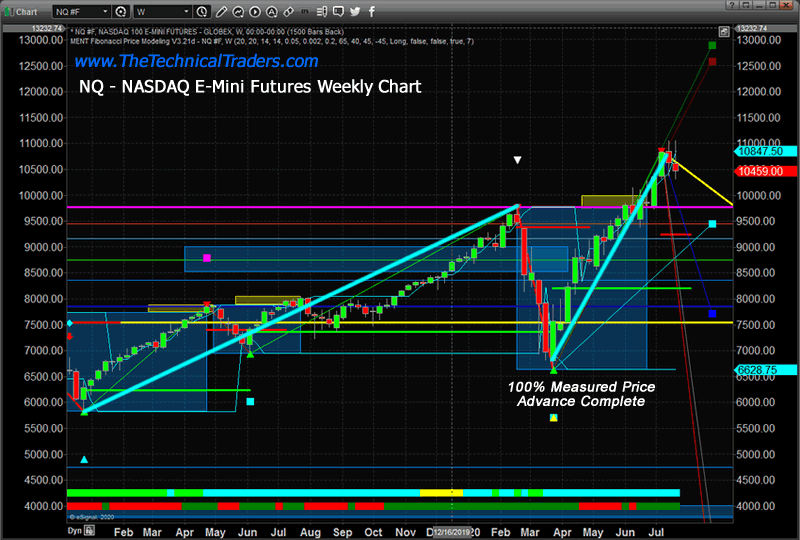
This NQ Weekly chart highlights the nearly 3,950 point rally from the low in December 2018 to the high formed on February 17, 2020. The current low formed in March 2020, near 6628, to the recent peak level, near 11,085, represents a “100% measured price advance” of 4,430 points. Yes, the current rally extended the 100% measured move by 12.15% – which often happens as price tests resistance or support. Measuring from Weekly closing bar to Weekly closing bar on this chart, the 100% measured move is only about 50 points away from a true 100% advance.
NASDAQ WEEKLY CHART
We believe this combination of technical price patterns suggests the US stock market, particularly the high-flying NASDAQ (NQ), may be setting up for a dramatic price decline. Both the Double Top and 100% Measured Move patterns suggest price has reached a limit. If our interpretation of these technical patterns is correct, after such an incredible price rally in the face of unsure future economic data, we believe a move back to 8,750 is not out of the question (or lower).
Before you continue,be sure to opt-in to our free-market trend signals before closing this page, so you don’t miss our next special report!
NQ FIBONACCI CHANNELS
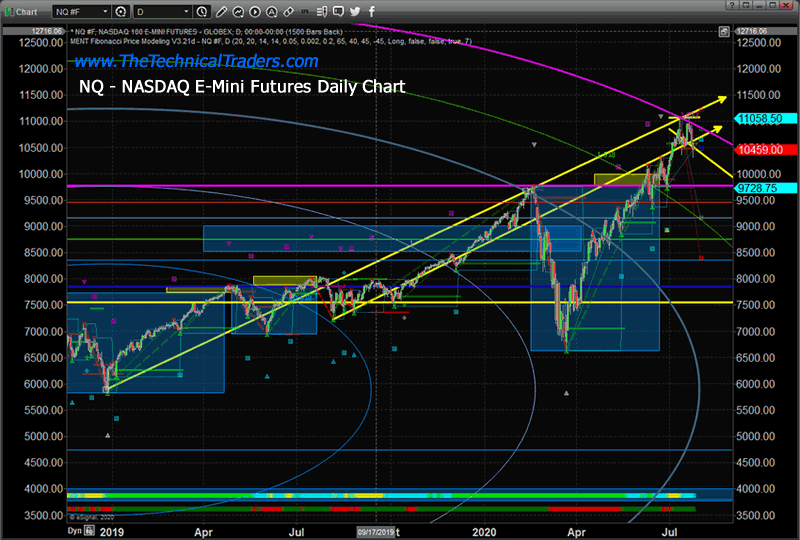
Very few people understand the relationship of Fibonacci price theory and how it relates to price action. Fibonacci Price Theory suggests that price must move higher or lower to establish new price highs or lows within a trend. Obviously, the NQ has rallied to “new price highs” – thus the current trend is “bullish”. Yet, a Double Top pattern is also a critical warning of resistance near the dual top level. Additionally, a 100% measured price advance is another warning sign that price may have reached an upside limit. Now, we add our proprietary Fibonacci Price Amplitude Arcs using a 0.854% Fibonacci extension level.
This extension level is not commonly used by many traders but is completely valid if you spend a bit of time exploring the Fibonacci Number Sequence and the relationship between the numbers. In fact, there are a number of levels between the 0.75% and 1.0% common Fibonacci levels that are valid for traders.
We have drawn the 1.854% Fibonacci Price Amplitude Arc in a MEGENTA color to highlight just how critical this level appears on the Weekly price chart. If our research is correct, we now have three technical/Fibonacci patterns that are setting up warning us that the NQ price may turn downward and begin a new downside price rotation. When we combine this with the data that we are expecting this week (GDP, Consumer and other data), this could turn into a “knockout blow” for the high-flying NASDAQ.
NASDAQ DAILY – FIBONACCI CHANNELS
If you were paying attention, you already know that the US Dollar is under pressure and the Precious Metals are showing signs that fear is rising in the global markets. This next week, and the weeks that follow, will likely result in global traders attempting to re-valuate expectations based on the level of destruction the COVID-19 virus has done to the US and global economy.
Our researchers expect a minimum of a 20% to 25% contraction in consumer and business engagement in the US – possibly much more. In March 2020, our research team suggested the Q1 and Q2 GDP data could contract by as much as -10% to -15%, potentially pushing the 2020 yearly GDP level into a -5% or deeper level. On Thursday, July 30, 2020, we’ll find out just how rough Q2 of 2020 really was for the US.
This is when the crap is likely to stick to the walls, so our advice would be to protect your open longs, prepare for increased volatility and don’t get married to any position you have right now. If you have not already prepared for this move, do it quickly early this week.
If the news is bad enough, there is no reason why the US and global markets could not attempt to retest recent low-price levels again. Remember, Fibonacci Price Theory suggests price is ALWAYS seeking new price highs or new price lows. Just because the NQ has reached new price high levels does not mean the S&P500, Dow Jones or other indexes, which have not reached new all-time highs, could not collapse and attempt to find new price low levels.
Get our Active ETF Swing Trade Signals or if you have any type of retirement account and are looking for signals when to own equities, bonds, or cash, be sure to become a member of my Passive Long-Term ETF Investing Signals which we are about to issue a new signal for subscribers.
Chris Vermeulen
www.TheTechnicalTraders.com
Chris Vermeulen has been involved in the markets since 1997 and is the founder of Technical Traders Ltd. He is an internationally recognized technical analyst, trader, and is the author of the book: 7 Steps to Win With Logic
Through years of research, trading and helping individual traders around the world. He learned that many traders have great trading ideas, but they lack one thing, they struggle to execute trades in a systematic way for consistent results. Chris helps educate traders with a three-hour video course that can change your trading results for the better.
His mission is to help his clients boost their trading performance while reducing market exposure and portfolio volatility.
He is a regular speaker on HoweStreet.com, and the FinancialSurvivorNetwork radio shows. Chris was also featured on the cover of AmalgaTrader Magazine, and contributes articles to several leading financial hubs like MarketOracle.co.uk
Disclaimer: Nothing in this report should be construed as a solicitation to buy or sell any securities mentioned. Technical Traders Ltd., its owners and the author of this report are not registered broker-dealers or financial advisors. Before investing in any securities, you should consult with your financial advisor and a registered broker-dealer. Never make an investment based solely on what you read in an online or printed report, including this report, especially if the investment involves a small, thinly-traded company that isn’t well known. Technical Traders Ltd. and the author of this report has been paid by Cardiff Energy Corp. In addition, the author owns shares of Cardiff Energy Corp. and would also benefit from volume and price appreciation of its stock. The information provided here within should not be construed as a financial analysis but rather as an advertisement. The author’s views and opinions regarding the companies featured in reports are his own views and are based on information that he has researched independently and has received, which the author assumes to be reliable. Technical Traders Ltd. and the author of this report do not guarantee the accuracy, completeness, or usefulness of any content of this report, nor its fitness for any particular purpose. Lastly, the author does not guarantee that any of the companies mentioned in the reports will perform as expected, and any comparisons made to other companies may not be valid or come into effect.
Chris Vermeulen Archive |
© 2005-2022 http://www.MarketOracle.co.uk - The Market Oracle is a FREE Daily Financial Markets Analysis & Forecasting online publication.