


Weakness in commodity prices suggests a slowing economy
Commodities / Commodities Trading Jul 23, 2020 - 12:23 PM GMTBy: Donald_W_Dony

As the world's economic engine starts to recover from the COVID-19 pandemic, the demand for certain key commodities are a good indicator of the rebound strength.
The S&P GSCI Commodity Index (Chart 1) is a collection of 24 commodities from all commodity sectors (energy products, industrial metals, agricultural products, livestock products and precious metals).
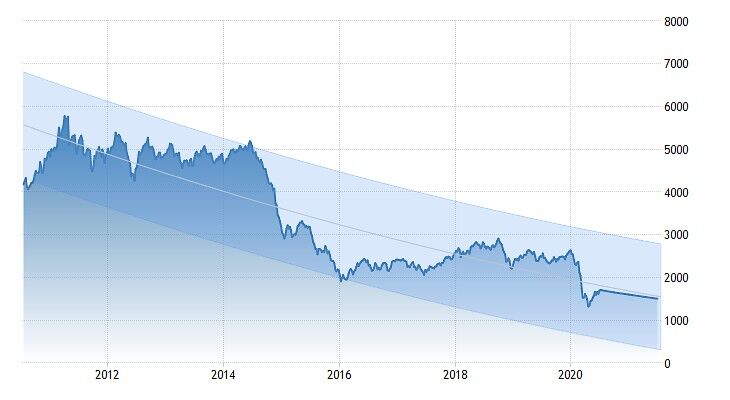
Since 2011, the index has been in a slow but steady decline. Most recent data (2020), shows the progression of the nine year trend continuing to descend.
The projection moving forward indicates that the commodity index price will be about 1600 by late 2020.
Chart 2 is of Light crude oil, the natural resource with the greatest trading volume. As with the GSCI index, the commodity price for WTI is also in a prolonged decline.
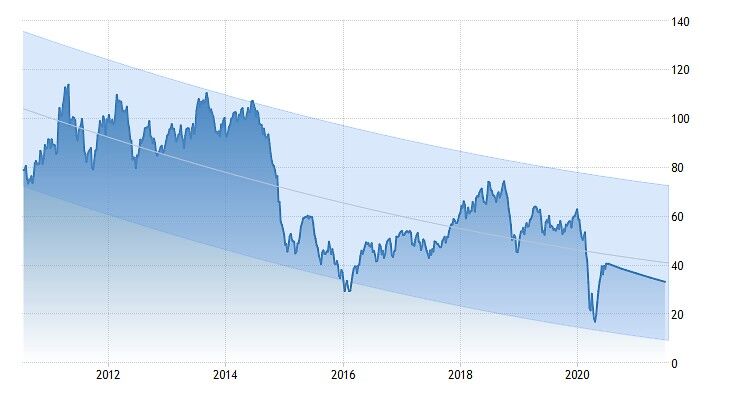
The recent price action indicates that demand has not increased significantly and the projection over the next six months, is for oil prices to soften slightly and reach about $38 by Q4.
Copper prices are believed to be a reliable indicator or measure of economic health (Chart 3).
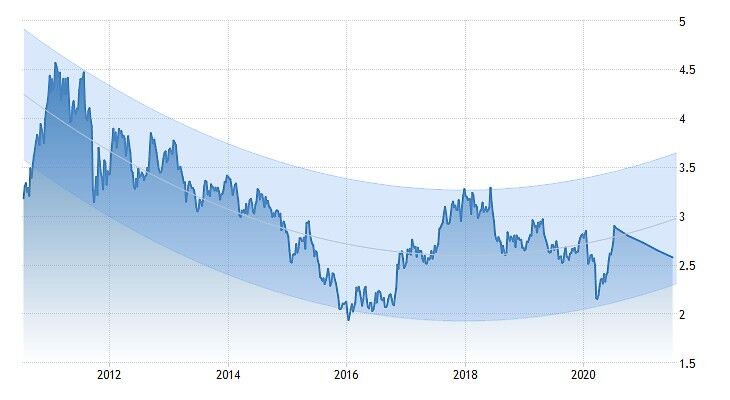
After dropping from the 2018 high of $3.40, the red metal appears to have found a low of around $2.00 to $2.25 in Q1. This action is promising as it suggests that global demand for the commodity is slowly increasing and stabilizing the price. Nevertheless, the outlook moving forward still indicates that copper prices should weaken in the second half of the year and retest $2.60 in Q4.
Bottom line: There are some early signs of increasing economic activity. The U.S. Unemployment Rate is inching its way down. The latest numbers are at 11.1% verses 13.3% in May. Job openings took an unexpected jump last month adding 401,000 and U.S.retail sales (MoM) advanced 17.7% in May.
An increase in economic activity is normally a positive for commodity prices. Yet, models are indicating that the recent strength in commodities is unlikely to hold and overall weakness in natural resource prices should be expected in Q3 and Q4.
This would suggest that there are more challenges ahead for the U.S. economy in the second half of the year.
By Donald W. Dony, FCSI, MFTA
www.technicalspeculator.com
COPYRIGHT © 2020 Donald W. Dony
Donald W. Dony, FCSI, MFTA has been in the investment profession for over 20 years, first as a stock broker in the mid 1980's and then as the principal of D. W. Dony and Associates Inc., a financial consulting firm to present. He is the editor and publisher of the Technical Speculator, a monthly international investment newsletter, which specializes in major world equity markets, currencies, bonds and interest rates as well as the precious metals markets.
Donald is also an instructor for the Canadian Securities Institute (CSI). He is often called upon to design technical analysis training programs and to provide teaching to industry professionals on technical analysis at many of Canada's leading brokerage firms. He is a respected specialist in the area of intermarket and cycle analysis and a frequent speaker at investment conferences.
Mr. Dony is a member of the Canadian Society of Technical Analysts (CSTA) and the International Federation of Technical Analysts (IFTA).
Donald W. Dony Archive |
© 2005-2022 http://www.MarketOracle.co.uk - The Market Oracle is a FREE Daily Financial Markets Analysis & Forecasting online publication.