


Stock Market Time for Caution?
Stock-Markets / Stock Markets 2020 Jul 20, 2020 - 09:38 PM GMTBy: Andre_Gratian

Current Position of the Market
SPX Long-term trend: For now, the best guesstimate is that we are still in the bull market which started in 2009.
SPX Intermediate trend: We should be approaching an important high, with confirmation coming over the next few days.
Analysis of the short-term trend is done daily with the help of hourly charts. It is an important adjunct to the analysis of daily and weekly charts which discuss longer market trends.
Daily market analysis of the short-term trend is reserved for subscribers. If you would like to sign up for a FREE 4-week trial period of daily comments, please let me know at anvi1962@cableone.net
Time for Caution?
Long Term: With the degree of recovery that SPX has made from the March low, it is likely that the 2192 was only wave 4 of the bull market which started in 2009.
Important cycles
36-td cycle 7/09 - The 40-wk cycle (~7/20) is apparently inverting – 45-td cycle ~8/14 -
Market Analysis (Charts courtesy of QCharts)
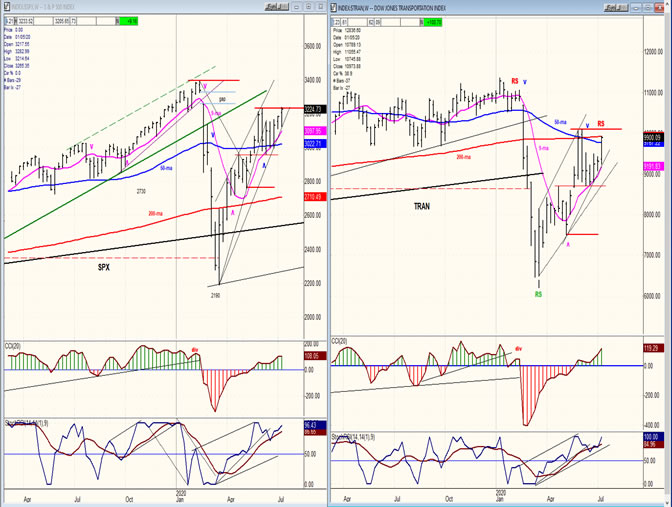
SPX- IWM weekly charts:
- Next week could be a transition point for the stock market because:
- Many of the programs which have sustained workers, small businesses and renters will soon end. Congress is still not unified on replacing them.
- The 40-wk cycle is peaking (instead of making a low) and about to reverse.
- The NDX, which has sustained the advance in SPX may already have peaked at 269. StockCharts has a bearish P&F projection for QQQ (259) to 236. This matches a .382 retracement from the March low to 230.
Next week could be a reality check for the stock market which, since its March low, has been unconcerned with the economic uncertainties that lie ahead. Last week SPX pierced through its former rally high by a fraction. The momentum could carry it slightly higher next week. If this is all it does before reversing sharply, it will most likely be a sign that the rally has come to an end and that we have started a correction. TRAN is still lagging.
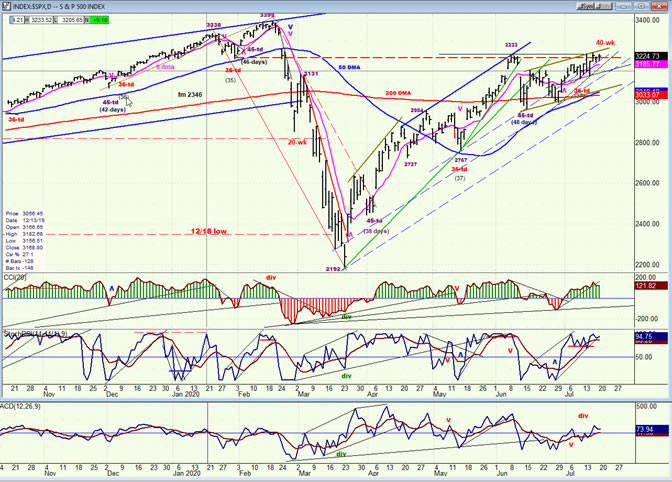
SPX daily chart
On Monday of last week, SPX overcame its June high by two points and was immediately shoved back over a hunded points. It tried again on Wednesday and managed to add another three points, but could go no higher and fell back. Friday, SPX saw a crawling rally which reached 3233, but could not close on its high. It is clear that the former high is being defended by sellers, but hope that something positive could come over the weekend kept prices near their highs. Next week will be a very important time slot for the stock market because of the reasons stated above. I should point out that the momentum oscillators are overbought and showing deceleration, but do not show the negative divergence which is normally a prerequisite for a reversal. Only the A-Ds have been showing divergence for the past two weeks. Nevertheless, the index is in need of a positive catalyst to keep it going higher. If that does not come, we could see the beginning of a correction of the uptrend which started in March. If, as claimed by Hadik that the 40-wk cycle is making a high instead of a low (something which is obvious enough by now), the odds favor a downward path once it has peaked.
Up to this point, all short-term P&F projections (except for the 3230 target which brought about a 108-point reversal and has yet to be exceeded) have only had a minimal impact on prices. The next level to watch is 3250-3260.
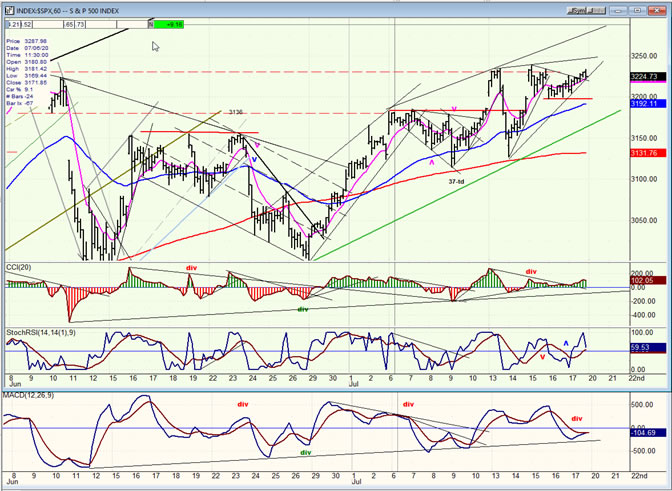
SPX hourly chart
Since Monday’s reversal from the 3230 P&F target, followed by a rally back to that level, the index has done little, perhaps waiting for more vaccine successes or another relief bill from congress. The oscillators are on hold as well, with negative divergence in both momentum and breadth. There is not much more that can be said beyond what was said above, and we must wait for a resolution to the current market condition.
The projection to 3250-60 could buy us a little more time, but the immediate path of the market will be determined by the action of the NDX which appears to have topped for now and is in the process of creating a congestion pattern. Ever since mid-April, SPX has bounced off its 200-hr MA six times! The MA is currently at 3114 which is also an important support level. Dropping below it would signal the start of a correction.
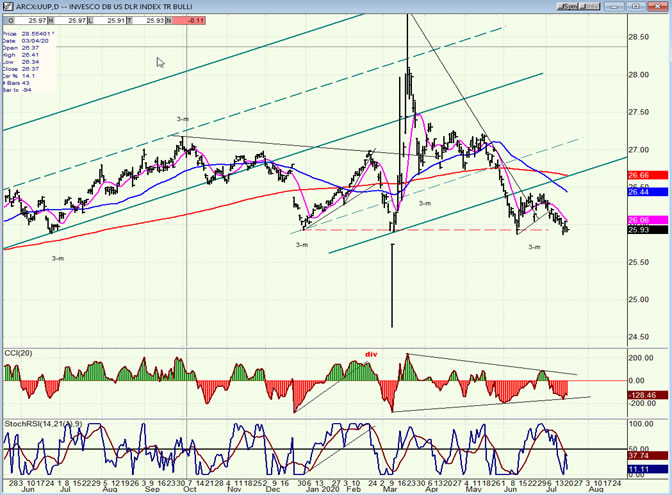
- UUP (dollar ETF)
- It does not look as if the 3-mo cycle has been able to support UUP. There could still be hesitation at this level, but new lows are likely. USD, which is trading at 95.86 has a short-term projection to 94-93.
-
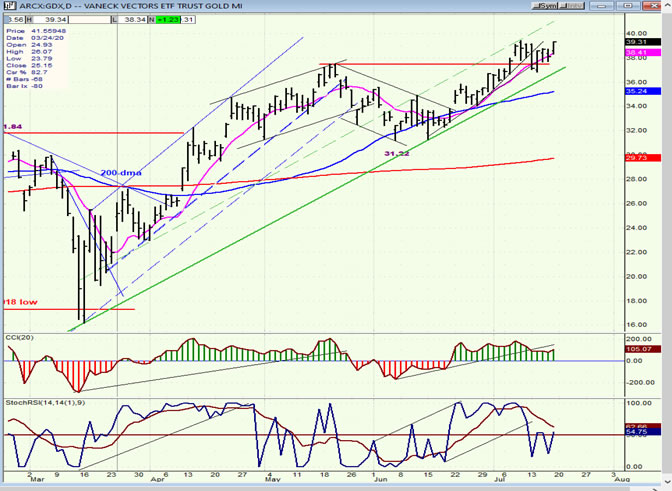
- GDX (gold miners)
- GDX has a near-term projection of ~40. If correct, reaching that price would lead to a reversal and correction, but since there are much higher eventual projections, it should be limited in time.
-
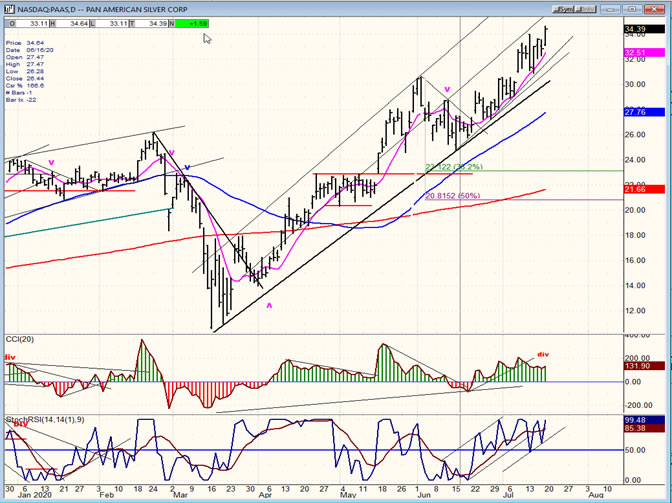
- PAAS (Pan American Silver Corp)
- PAAS should get to 35+ before reversing and consolidating in conjunction with GDX.
-
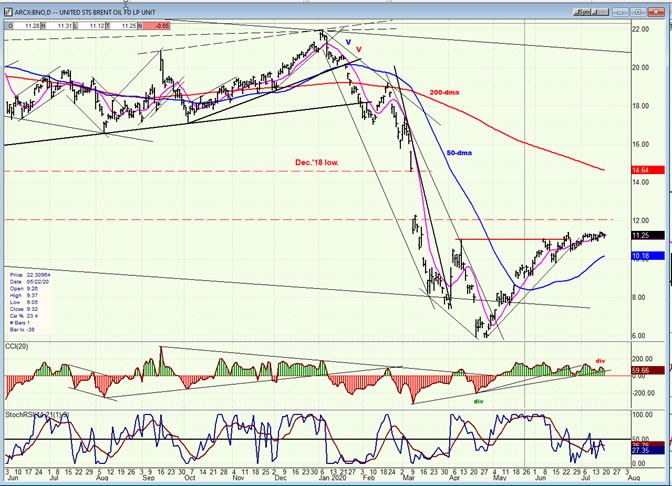
- BNO (U.S. Brent Oil fund)
- BNO is ready to pull back along with the market. It needs to retest its low and create a base.
- Summary
Andre
FREE TRIAL SUBSCRIPTON
For a FREE 4-week trial, send an email to anvi1962@cableone.net, or go to www.marketurningpoints.com and click on "subscribe". There, you will also find subscription options, payment plans, weekly newsletters, and general information. By clicking on "Free Newsletter" you can get a preview of the latest newsletter which is normally posted on Sunday afternoon (unless it happens to be a 3-day weekend, in which case it could be posted on Monday).
Disclaimer - The above comments about the financial markets are based purely on what I consider to be sound technical analysis principles uncompromised by fundamental considerations. They represent my own opinion and are not meant to be construed as trading or investment advice, but are offered as an analytical point of view which might be of interest to those who follow stock market cycles and technical analysis.
Andre Gratian Archive |
© 2005-2022 http://www.MarketOracle.co.uk - The Market Oracle is a FREE Daily Financial Markets Analysis & Forecasting online publication.