


The Darkening Clouds on the Stock Market S&P 500 Horizon
Stock-Markets / Stock Markets 2020 Jul 02, 2020 - 02:21 PM GMTBy: Paul_Rejczak

Friday's overnight gains evaporated faster than you could say Jack Robinson, and not much bottom fishing came later that day. Is the tide in stocks turning – or has it turned already? With Thursday's financial news-driven gains reversed in a flash, it's tempting to say so – especially when coupled with the other signs I see in the charts.
In short, more downside appears likely, confirming what I said in Friday's analysis. A quick quote: "Despite the generally positive S&P 500 performance during the runups to Independence Day, the new Fed rules might not have saved the day yet. Trading remains choppy, corona cases just made a new U.S. daily high, and the elections are getting closer."
Will the market agree?
S&P 500 in the Medium- and Short-Run
I’ll start today's flagship Stock Trading Alert with the weekly chart perspective (charts courtesy of http://stockcharts.com ):
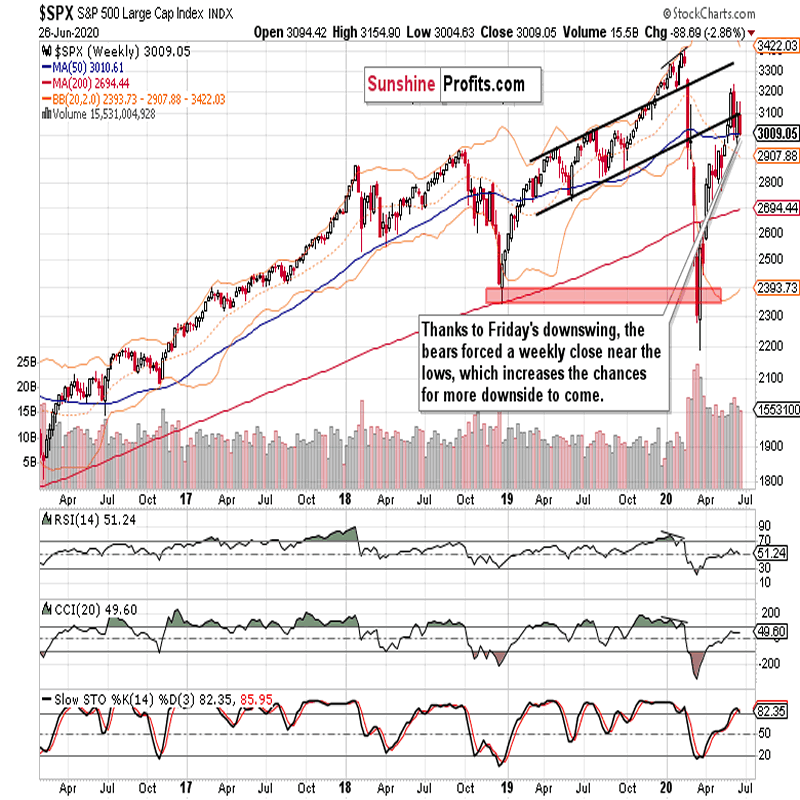
The weekly candle's opening and closing prices were practically the same going into Friday's session – but that day changed a lot as you can see. Within Friday's analysis, I mentioned the tellingly long upper knots in the two prior weeks, pointing out that a daily downswing would increase the chances of seeing a reversal.
That's what is happening, and I carried on with these observations still on Friday:
(…) Just as the March volume examination showed heavy accumulation, and stock bears unable to reassert themselves right next, last weeks' trading smacks of distribution, of selling into strength. Yes, that's the result of the bulls being unable to stage a comeback this week (so far – we'll soon learn, but the odds favor a downside move).
The thorn in the bears' side is that prices are still trading above the 50-week moving average (roughly corresponding to the 200-day moving average on the daily chart, at 3010 and 3020). Breaking below this support would likely lead to accelerated selling, but we're having none of this so far.
What about the bullish side of the argument? It's about moving prices back into the rising black trend channel – again, we aren't seeing any of this.
The weekly indicators are looking fairly extended, which wouldn't be an issue – but the weakening uptrend in CCI or the RSI continuously unable to overcome its neutral readings, is.
So, these are the reasons why I think yesterday's financial sector news isn't a real game changer, and why I see persisting risks to the downside. True, they might not materialize in the very short run, but the reward potential is higher for the bears here, the longer the above issues persist.
We have seen the daily downswing indeed materialize, and it brought the S&P 500 right to the 50-week moving average (and a tad below the 200-day moving average on the daily chart). These levels were pierced.
The support withstood Friday's selling pressure, but remains in a precarious position – I am unconvinced by the little intraday bounces as the bulls really could have stepped up to the plate some more. This can't be even called a dead cat bounce (or a toned-down base-building), raising questions about the bulls' strength in the now.
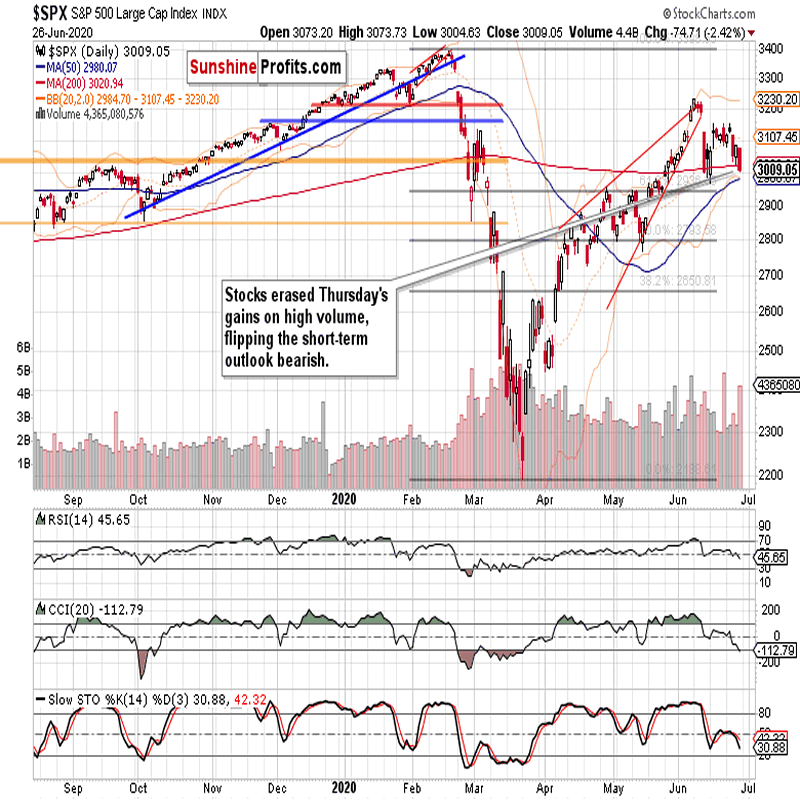
Thursday's gains turned history, prices closed below that day's intraday lows, and it happened on really high volume. The Wednesday-discussed fleeting stabilization of daily indicators in the end proved temporary indeed, and the bear raid I discussed, wildly succeeded. The daily close so near the intraday lows makes follow through selling on Monday likely.
On one hand, we have these bearish factors and strengthening corona fears (risks of renewed lockdowns or disruptions to economic activity in general), on the other the uncertain effects of Q2 window dressing and generally rather positive seasonality going into Independence Day.
Given the prominence of each of the above factors, I see the bearish side as the one favored by the odds – do the credit markets agree?
The Credit Markets’ Point of View
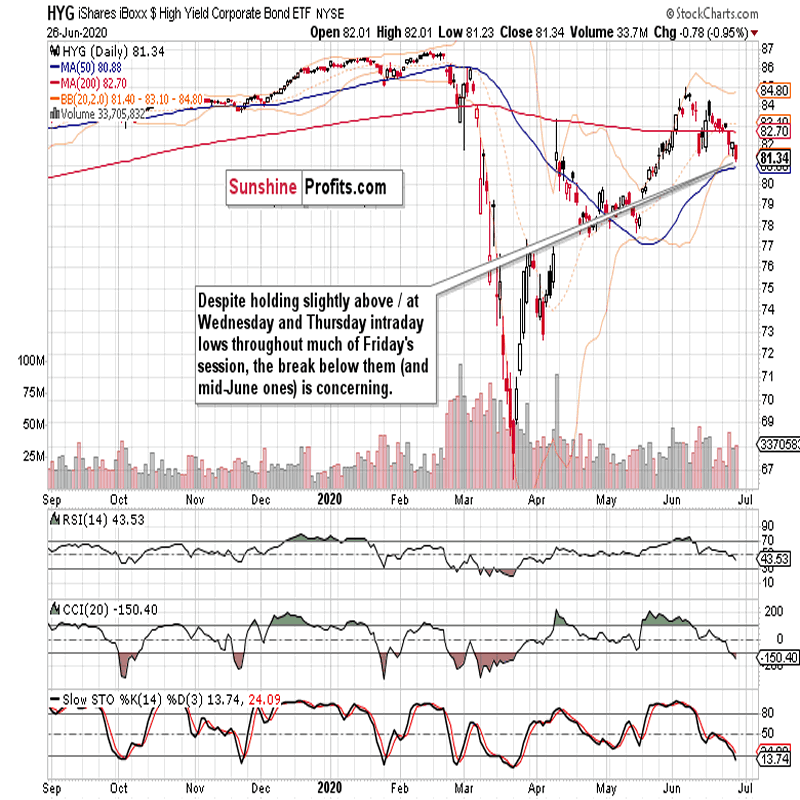
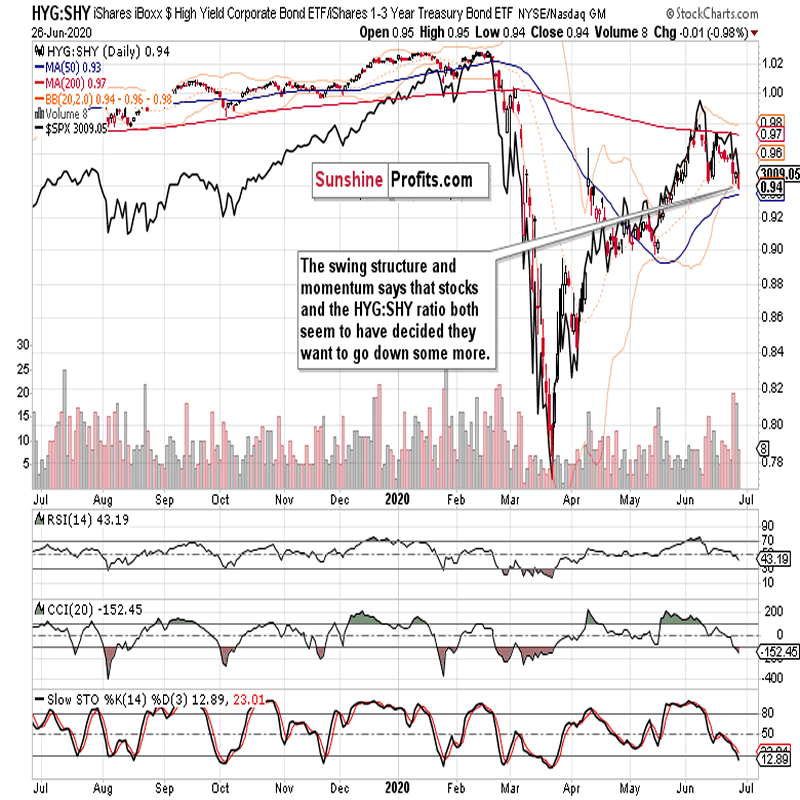
High yield corporate bonds (HYG ETF) broke below the Wednesday and Thursday intraday lows in the end, and the daily indicators don't rule out more deterioration. Not good for the stock bulls.
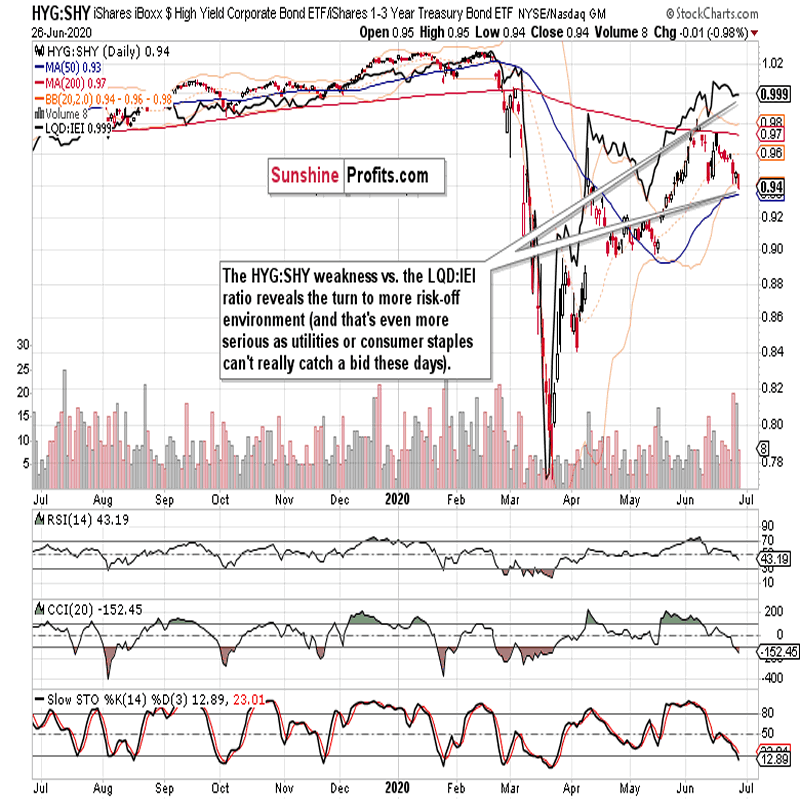
But the investment grade corporate bonds to the longer-term Treasuries (LQD:IEI) ratio is holding up better than the high yield corporate bonds to short-term Treasuries one (HYG:SHY). But do two days qualify as a turnaround?
I don't think so, and the below chart tells you why.
High yield corporate bonds to corporate bonds (PHB:$DJCB) ratio has been doing badly recently, and challenges the rising support line made by the recent local lows. The appetite for more risk in the corporate bonds arena seems disappearing, which doesn't bode well for the stock bulls.
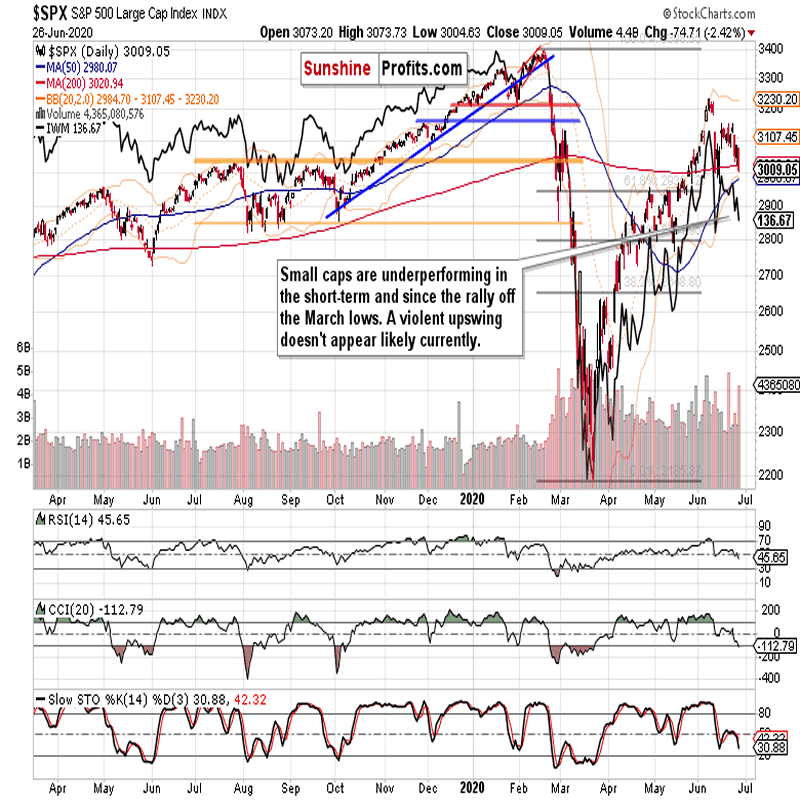
Just take a look at how the Q1 strength in the S&P 500 vs. the weakness in the ratio turned out over the coming weeks. We might be at the doorstep of a challenge to the bull market assessment. The key supports to hold are the 200-day moving average (3020, and if you take the 50-week moving average, then 3010), the 61.8% Fibonacci retracement (2940) and the 50% Fibonacci retracement (2790) on the daily chart.
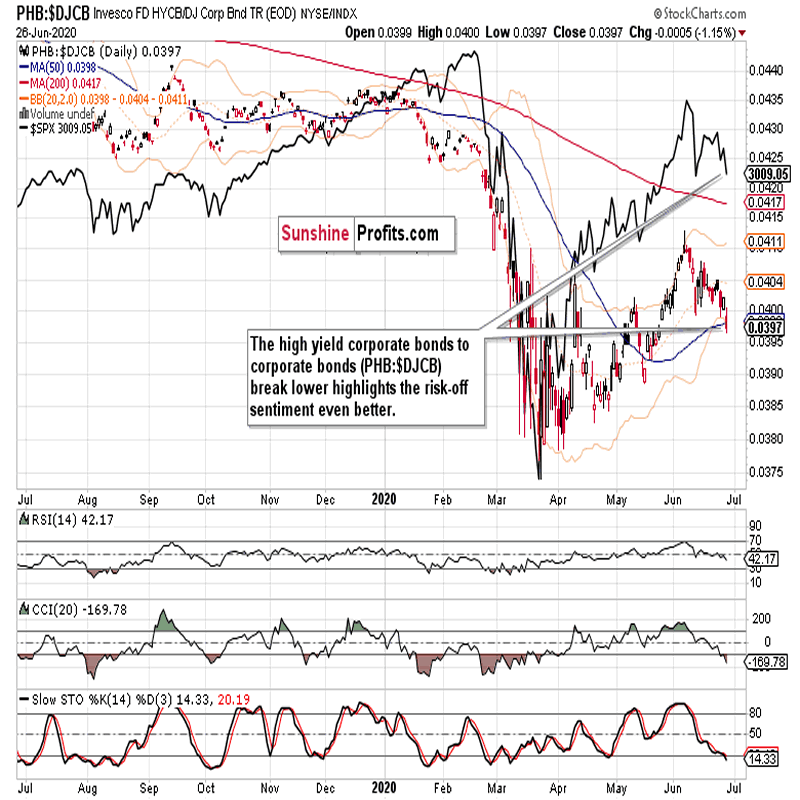
The caption says it all. It's about direction, and both metrics appear ready to go down some more.
Let's quote these Friday's thoughts:
(…) I still stand by the call for rougher trading over the summer. Look, elections are drawing nearer, the polls are showing… whatever – what would happen once the markets start discounting the prospects of Biden presidency more? Markets hate uncertainty, and the Trump years brought us many pro-business policies. Will they continue? What new ones would take their place?
As summer progresses, that could influence stocks more than corona / lockdown fears. The markets would tell us as we go. As I showed you on the weekly chart, the risks are skewed more to the downside in the short- and medium-term.
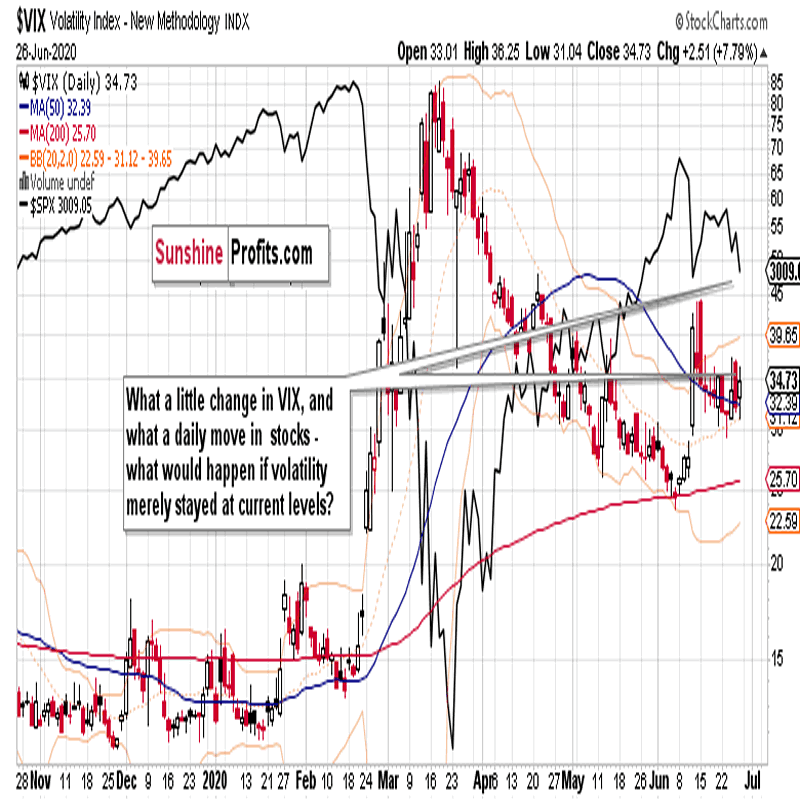
Volatility appears not really willing to decline from current levels much, which supports the notion of rougher waters ahead. I don't think it would stay this low in July or August.
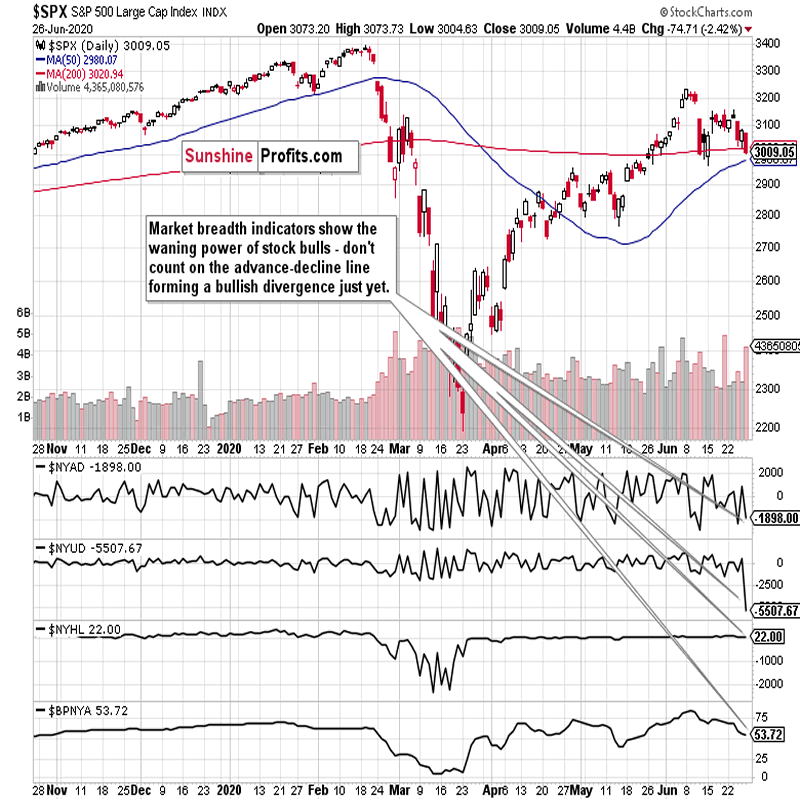
The market breadth indicators highlight the shifting sands. The advance-decline line hasn't surpassed its mid-June highs – and on a weekly basis, it's challenging its late-April bottom. The bullish percent index also reveals the mounting troubles for the bulls.
Let's move next to the sectoral analysis.
Key S&P 500 Sectors in Focus
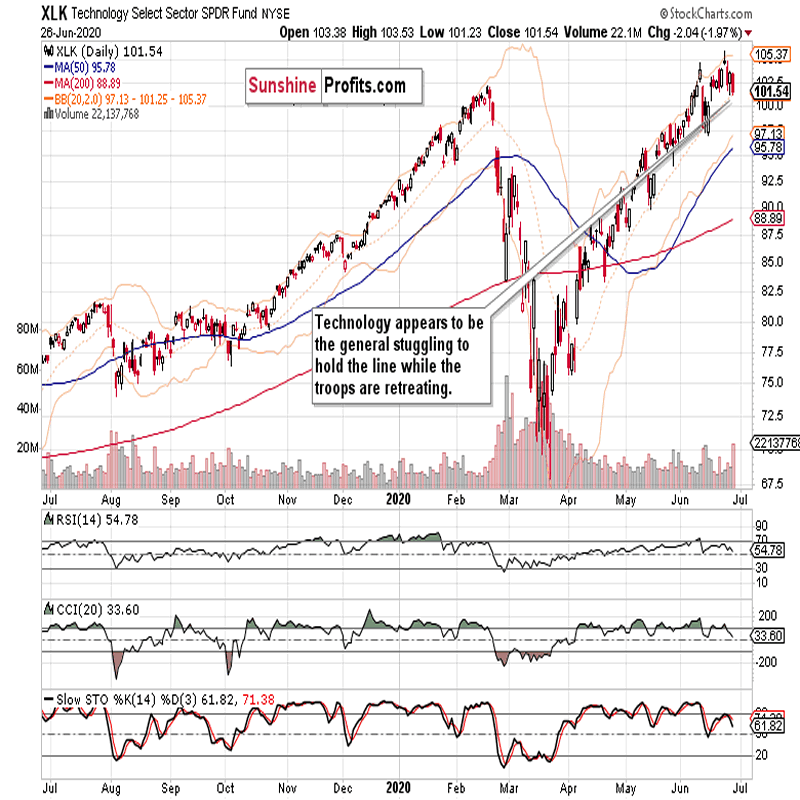
Technology (XLK ETF) has stalled recently, and I wouldn't take Friday's downswing on high volume as a sign of accumulation just yet. What concerns me, is that this has been the start performer of the move higher off the March lows – which implies that much of the rest has been lagging behind.
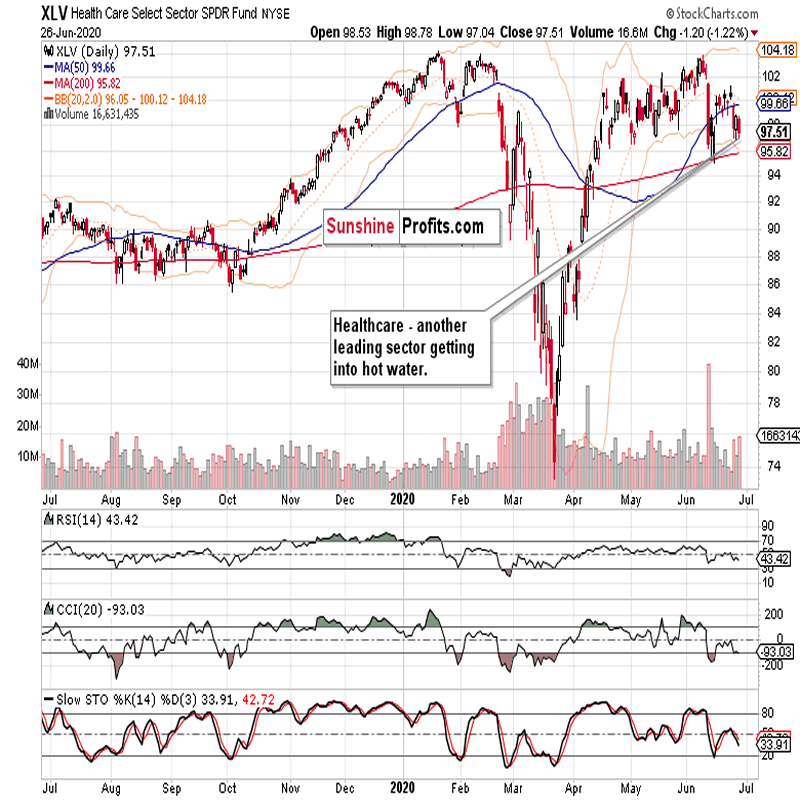
Healthcare (XLV ETF) was the second sectoral heavyweight engine of growth, and it has already made a lower high (unlike the tech, which made a higher high). That's concerning for the stock bulls, because whenever the generals are among the last to hold ground while the rest shows weakness, it's time to put one's guard up.
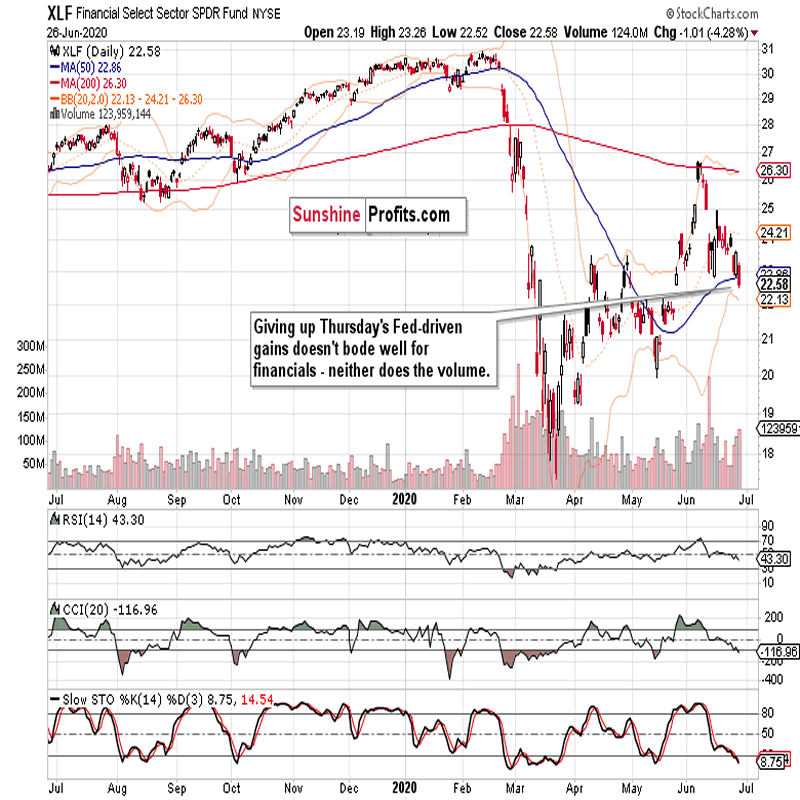
The veracity in erasing Thursday's news-driven gains in the financials (XLF ETF), is concerning.
Consumer discretionaries (XLY ETF) approximate the healthcare performance, but how resilient will the sector be once lockdown fears rear their truly ugly head?
Among the defensive sectors, both utilities (XLU ETF) and consumer staples (XLP ETF) took it on the chin, and are approaching their mid-May lows. While that makes both leading ratios (XLF:XLU and XLY:XLP) look relatively healthy, don't be taken in – all of these sectors are sinking currently. The only bullish interpretation possible is that the growth sectors are holding up better than the defensive ones, which would point to rotation into growth plays.
Within the stealth bull market trio, let's start with energy (XLE ETF). Given the relative stability of oil prices in recent weeks (that's an understatement as they've been slowly marching higher actually), one would expect a stronger sectoral performance – but remember that the US shale companies are under serious pressure as both Saudi Arabia and Russia price war moves have inflicted pain upon the sector.
In April, the nearest futures contract prices went even negative as so much demand has come offline. But I stand by my call for higher oil prices in Q3 and Q4 especially – just take a look at the June 22 From the Readers' Mailbag section – I talk gold there as well.
Okay, it's the materials' (XLB ETF) turn now. They're holding up relatively better, which reflects the rising inflation expectations (I cover these in the course of answering the gold question in the June 22 Stock Trading Alert).
Despite the encouraging manufacturing activity data, industrials (XLI ETF) are weaker than the materials. Taken together with energy and materials, the stealth bull market trio isn't really helping the S&P 500 move higher, which serves as a red flag.
From the Readers' Mailbag
Q: I read an article on seeking alpha predicting upward movement of Russell 2000 in the 3rd quarter, suggesting buying the IWM and staying long. What's your take on this Monica?
A: Let's start with the situation in the now.
The Russell 2000 (IWM ETF) is still acting weak, with the caption again saying it all. The prospects for it to catch up over Q2 are limited in my opinion. Once we have the election uncertainty removed, the prospects for smallcaps get better. But we might be facing corona and flu panic in autumn as well, which wouldn't really help the sector.
So, I ask – is it really a good time to buy now?
Summary
Summing up, Friday's session raised the specter of more selling over the coming weeks, and justifiably so. Credit market metrics have weakened, market breadth deteriorated, and volatility is far from tamed. The weekly chart is sending ominous signals while the Russell 2000 continues to underperform. Among the sectors, technology can't save the day.
Significant short-term risks persist amid the choppy trading (now with a downside bias) characterizing last two weeks. The medium-term examination favors the bears now. Should the market get spooked by corona even more down the road, that would be a cherry on the cake for the bears.
As the saying goes, you're on the right track with stock bulls – but stay there long enough, and you get run over – and the S&P 500 setup these days is precarious.
We encourage you to sign up for our daily newsletter - it's free and if you don't like it, you can unsubscribe with just 2 clicks. If you sign up today, you'll also get 7 days of free access to our premium daily Stock Trading Alerts as well as our other Alerts. Sign up for the free newsletter today!
Thank you.
Monica Kingsley
Stock & Oil Trading Strategist
Sunshine Profits - Effective Investments through Diligence and Care
Monica Kingsley is a trader and financial markets analyst. Apart from diving into the charts on a daily basis, she is very much into economics, marketing and writing as well. Naturally, she has found home at Sunshine Profits - a leading company that has been publishing quality analysis for more than a decade. Sunshine Profits has been founded by Przemyslaw Radomski, CFA - a renowned precious metals investor and analyst.
Disclaimer
All essays, research and information found above represent analyses and opinions of Przemyslaw Radomski, CFA and Sunshine Profits' associates only. As such, it may prove wrong and be a subject to change without notice. Opinions and analyses were based on data available to authors of respective essays at the time of writing. Although the information provided above is based on careful research and sources that are believed to be accurate, Przemyslaw Radomski, CFA and his associates do not guarantee the accuracy or thoroughness of the data or information reported. The opinions published above are neither an offer nor a recommendation to purchase or sell any securities. Mr. Radomski is not a Registered Securities Advisor. By reading Przemyslaw Radomski's, CFA reports you fully agree that he will not be held responsible or liable for any decisions you make regarding any information provided in these reports. Investing, trading and speculation in any financial markets may involve high risk of loss. Przemyslaw Radomski, CFA, Sunshine Profits' employees and affiliates as well as members of their families may have a short or long position in any securities, including those mentioned in any of the reports or essays, and may make additional purchases and/or sales of those securities without notice.
© 2005-2022 http://www.MarketOracle.co.uk - The Market Oracle is a FREE Daily Financial Markets Analysis & Forecasting online publication.