


Where is the US Dollar trend headed ?
Currencies / US Dollar Jun 22, 2020 - 04:02 PM GMTBy: readtheticker

where-is-the-us-dollar-trend-headedJesse Livermore said we consider all matters concerning the market, this includes demand and supply fundamentals, general conditions and price patterns.
A high US dollar is the mighty destroyer of all, it explodes foreign debt and risk assets, and it will likely change US politics.
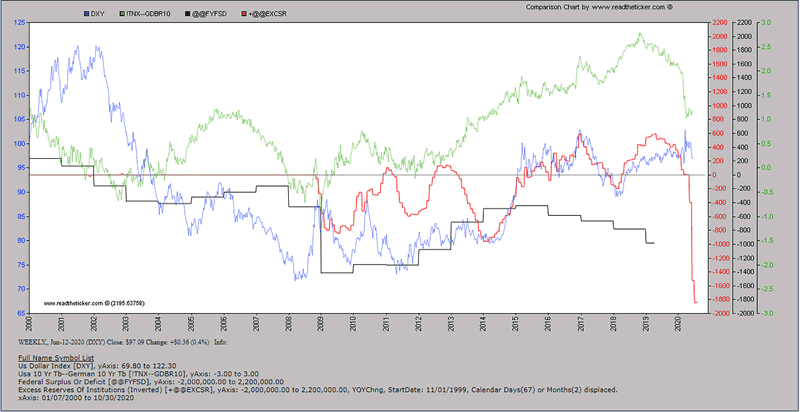
The chart below supports a greater supply of US dollars and a bearish dollar view.
The green line is the spread between the German 10 yr interest rate versus the US 10 yr interest rates, and it is showing bearish pressure on the US dollar. The black line is the trend of the US twin deficits and the US dollar as followed this trend over a very long time and the forecast is for deeper deficits into 2020-22.
The red line is the growth of the US dollar deposits in institutions (turned up side down, or inverted), the more supply of US dollars is bearish for the US dollar. The massive explosion of the red line is directly related to the US Federal Reserve money printing. The TRUMP administration is doing all it can to cap or lower the US dollar, maybe it is lagging the the bearish fundamentals, however we must wonder why the US dollar is not crashing down to $65.
The bullish support for the the US dollar is the growth of US dollar assets and liabilities out side the US.
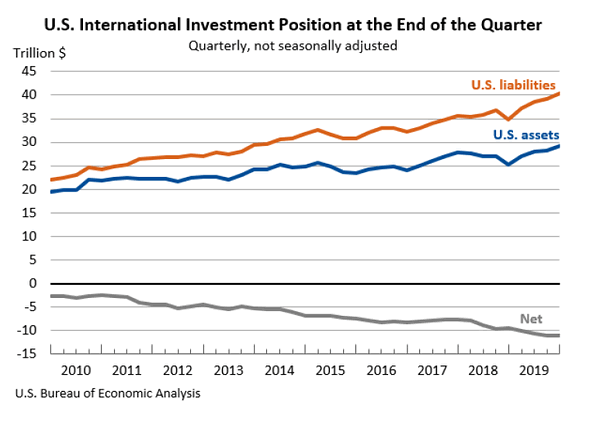
As you can see the levels are $30 to $40 trillion. Massive! This matters because a negative change in these levels will create a shortage of US dollars. If the holders of the above get nervous with economic conditions, COVID19 second/third wave or China - US relations this could promote a wave of selling, which is US dollar supply destruction, hence a shortage, which leads to greater demand and higher prices as the world needs US dollars to trade.
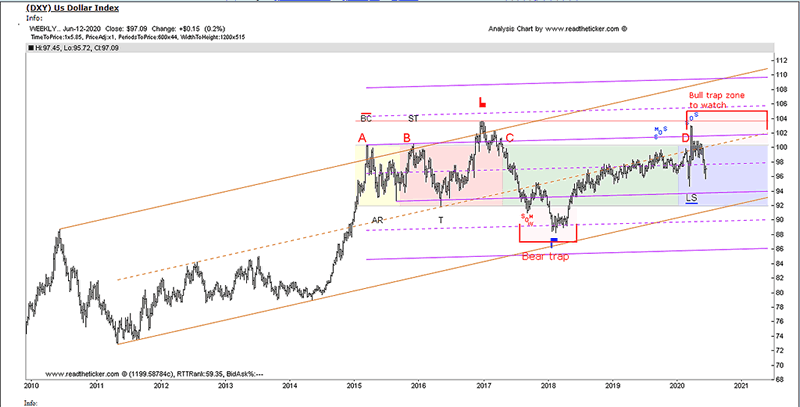
The chart below is the US Dollar (DXY) with Richard Wyckoff demand and supply analysis.
Price action into 2020 has shown strength, testing the bull trap zone, currently the pullback is into middle (or muddle) ground and on the balance US dollar strength is still in the chart. However, price could easily test $92 - $94 and return with strength to $102. But in truth true demand and supply is expressed at support ($92) and resistance ($102) levels and while price is in the middle (or muddle) zone not much can be done, therefore we must wait for more price evidence to see which fundamentals are taking charge. If the financial shock of COVID19 is not over then higher US dollar prices can be expected as we all know the US FED can not create jobs with money printing.
Fundamentals are important, and so is market timing, here at readtheticker.com we believe a combination of Gann Angles, Cycles, Wyckoff and Ney logic is the best way to secure better timing than most, after all these methods have been used successfully for 70+ years. To help you applying Richard Wyckoff and Richard Ney logic a wealth of knowledge is available via our RTT Plus membership. NOTE: readtheticker.com does allow users to load objects and text on charts, however some annotations are by a free third party image tool named Paint.net Investing
NOTE: readtheticker.com does allow users to load objects and text on charts, however some annotations are by a free third party image tool named Paint.net
Readtheticker
My website: www.readtheticker.com
We are financial market enthusiast using methods expressed by the Gann, Hurst and Wyckoff with a few of our own proprietary tools. Readtheticker.com provides online stock and index charts with commentary. We are not brokers, bankers, financial planners, hedge fund traders or investment advisors, we are private investors
© 2020 Copyright readtheticker - All Rights Reserved
Disclaimer: The material is presented for educational purposes only and may contain errors or omissions and are subject to change without notice. Readtheticker.com (or 'RTT') members and or associates are NOT responsible for any actions you may take on any comments, advice,annotations or advertisement presented in this content. This material is not presented to be a recommendation to buy or sell any financial instrument (including but not limited to stocks, forex, options, bonds or futures, on any exchange in the world) or as 'investment advice'. Readtheticker.com members may have a position in any company or security mentioned herein.
© 2005-2022 http://www.MarketOracle.co.uk - The Market Oracle is a FREE Daily Financial Markets Analysis & Forecasting online publication.