


This Major Stock Market Indicator is Flashing a HUGE Signal
Stock-Markets / Stock Markets 2020 Apr 28, 2020 - 06:04 PM GMTBy: EWI

Here's what should happen during a bear-market rally as sentiment rises
A question was posed to Elliott Wave International President Robert Prechter for a classic Elliott Wave Theorist (Prechter's monthly publication about financial markets and social trends since 1979):
Under the Wave Principle, what is the most important thing to watch other than price?
Prechter answered:
Volume.
You see, high trading volume means that traders are displaying a great deal of conviction about a given market, whether the trend is up or down. Low trading volume means a lack of enthusiasm.
In other words, during strong bull markets, up days are often accompanied by high trading volume, while countertrend declines usually occur on low trading volume. In bear markets, down days are generally powered by tons of trading volume with rallies occurring on weak volume.
When a bear market is near an end, price declines usually begin to occur on contracting volume. Likewise, when a bull market is exhausted, price rises are usually accompanied by waning volume.
For example, here's a chart and commentary from EWI's Oct. 5, 2007 U.S. Short Term Update:
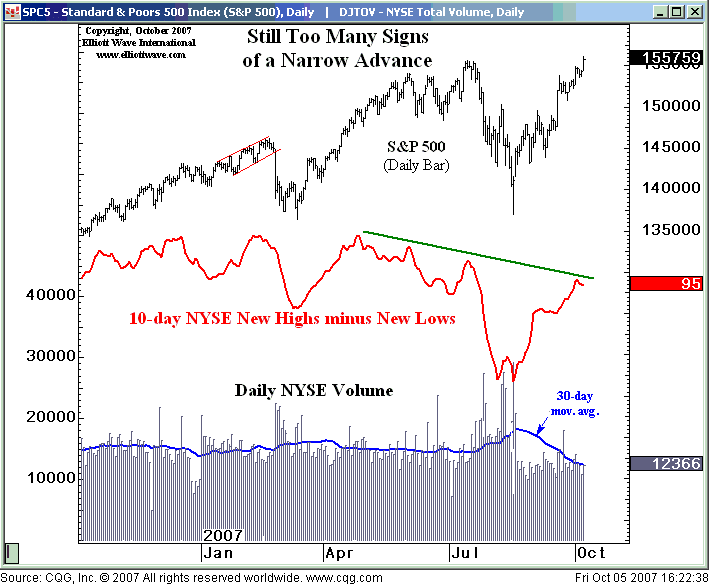
Note how weak the volume pattern has been in the push from the August 16 low, which is one of the reasons that we keep saying the rise is "narrow." The middle clip on the chart shows the 10-day average of NYSE New Highs minus New Lows, showing yet another indicator that is lagging as prices make new highs.
Less than a week later, the S&P 500 index hit a then intraday record high before beginning a bear market slide.
Now, let's consider the current market environment, and this chart and commentary from the April 20, 2020 U.S. Short Term Update:
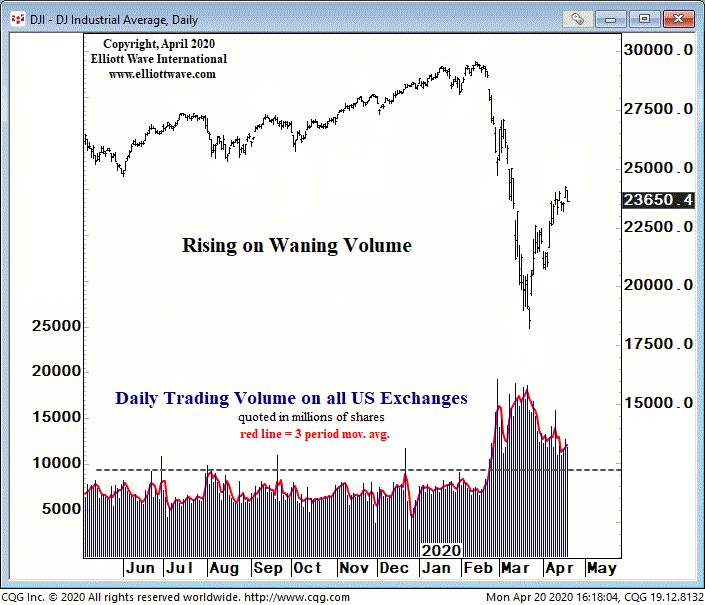
The power of a second-wave rally should wane as sentiment rises. So far, the market's advance since March 23 fits this profile. As the chart shows, daily market volume has contracted steadily as the advance has progressed. The 3-day average has come back to nearly the level it was in late-February, when the Dow was still above 27,000.
Now, let's get back to that question from the classic Theorist about "the most important thing to watch other than price."
The question itself implies that no other indicator is as important as price -- or price patterns, to be more exact. And that is absolutely correct.
As Frost & Prechter's Elliott Wave Principle: Key to Market Behavior notes:
Since wave analysis is based upon price patterns, a pattern identified as having been completed is either over or it isn't. If the market changes direction, the analyst has caught the turn. If the market moves beyond what the apparently completed pattern allows, the conclusion is wrong, and any funds at risk can be reclaimed immediately.
You can read the online version of this Wall Street classic book in its entirety -- 100% free. Simply sign up for a free Club EWI membership for instant access.
This article was syndicated by Elliott Wave International and was originally published under the headline This Major Stock Market Indicator is Flashing a HUGE Signal. EWI is the world's largest market forecasting firm. Its staff of full-time analysts led by Chartered Market Technician Robert Prechter provides 24-hour-a-day market analysis to institutional and private investors around the world.
© 2005-2022 http://www.MarketOracle.co.uk - The Market Oracle is a FREE Daily Financial Markets Analysis & Forecasting online publication.