


Crude Oil's 2020 Crash: See What Helped (Some) Traders Pivot Just in Time
Commodities / Crude Oil Apr 07, 2020 - 10:50 AM GMTBy: EWI

The coronavirus wasn't the cause of oil's 70% collapse. This was
Let's start by establishing that the stock market is not driven by the news. Aggregate stock prices are driven by waves of optimism and pessimism -- which go from one extreme to another -- as reflected by the Elliott wave model. That's what makes the stock market predictable.
Hence, Elliott wave analysis is at the core of EWI's stock market forecasts.
Having said that, sentiment indicators are also valuable in providing clues about "what's next."
For example, Robert Prechter's book, Prechter's Perspective, made this observation:
No crowd buys stocks of other countries intelligently. For decades, heavy foreign buying in the U.S. stock market has served as an excellent indicator of major tops.
Since the start of 2020, crude oil has gone from "black gold" to "black days," plummeting 70% for its "worst quarter on record" (March 30, Bloomberg).
As of March 30, oil prices circled the drain of a two-DECADE low near $20 per barrel.
Is there any way an oil trader or active oil investor could look at the market's crash and NOT see what one March 12 CNN article coined "a nightmare scenario"?
That depends on one simple factor; i.e. did that trader/investor's methodology enable him/her to pivot in time to anticipate oil's downturn before it went from blip to "bloodbath" (March 10, Fortune)?
In his timeless Trader’s Classroom eBook "14 Critical Lessons Every Trader Should Know," Elliott Wave International's senior instructor Jeffrey Kennedy asserts that the #1 "fatal flaw" for any trader is a "lack of methodology." Writes Jeffrey:
"If you aim to be a consistently successful trader, then you must have a defined trading methodology, which is simply a clear and concise way of looking at markets.
"If you don't have a defined trading methodology, then you don't have a way to know what constitutes a buy or sell signal.
"Moreover, you can't even consistently correctly identify the trend."
So, it's not just about having a methodology. It's about having the right methodology.
In the case of crude oil, many oil participants rely on the mainstream methodology known as fundamental analysis. It says market trends are driven by external events related to that market. As of March 30, the event responsible for crude's 2020 crash is the coronavirus, and the substantial contraction in fuel demand that has resulted from the ongoing, virus-driven travel bans.
Said one March 30 BBC:
"Coronavirus: Oil price collapses to lowest level for 18 years... The price of oil has sunk to levels not seen since 2002 as demand for crude collapses amid the coronavirus pandemic."
That is now, March 30, 70% down and three months into crude's crash.
But what about then, in early January, when oil prices orbited an 8-month high near $70 per barrel?
The coronavirus was barely a dot on crude oil's radar, having taken just two lives and sickened 45 all overseas. As one health expert predicted in a January 17 New York Times:
"There will probably be cases in the United States at some point, but we believe the current risk from the virus to the general public is low."
COVID-19 wasn't the bearish news event oil experts were watching; the bullish escalating tensions in the Middle East -- set off by the January 3 US drone attack which killed the "second most powerful man in Iran" General Qassem Soleimani -- were. A series of retaliations by Iran followed, culminating in Iran's threat to block exports of oil through the vital gateway the Strait of Hormuz. Wrote one January 8 CNBC:
"Oil prices will climb above $100 a barrel if Iran blocks the Strait of Hormuz."
Added another news source: "An extended period of conflict in the region will support prices by fueling uncertainty, even as alternative suppliers step up." (Oil and Gas Journal)
Yet -- instead of the ongoing conflict supporting prices, oil turned down on January 6 and didn't look back. The fundamental methodology failed to prepare traders, either for the direction or the depth of that turn.
The methodology known as the Wave Principle did both.
Meet the Elliott Wave Principle, Esquire
In his Trader's Classroom eBook "14 Critical Lessons Every Trader Should Know," Jeffrey half-jokes that the best trading methodologies are so simple, they can "fit on the back of a business card."
And in his January 17 Commodity Junctures Service, Jeffrey used the tools and rules of the Wave Principle to identify an alternate bearish wave count for crude oil that called for prices to be slashed in half from current levels. In Jeffrey's words:
"The big narrative when you start looking at the weekly and monthly crude oil charts is -- any strength we see is going to fail."
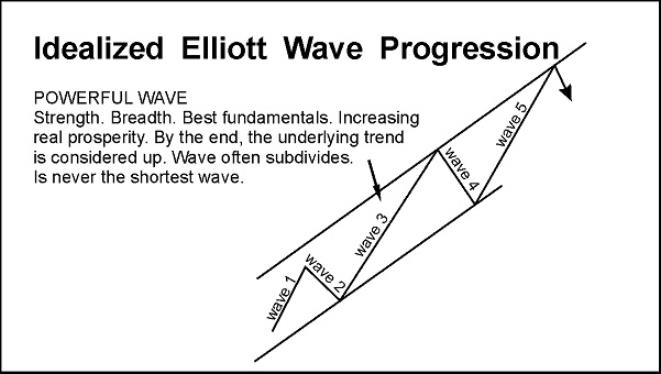
The basis of Jeffrey's bearish analysis was the possibility that wave 2 was over, setting the stage for a third wave decline. Pictured below: Jeffrey's January 17 Commodity Juncture Service chart of crude oil followed by an idealized diagram of an Elliott third wave.
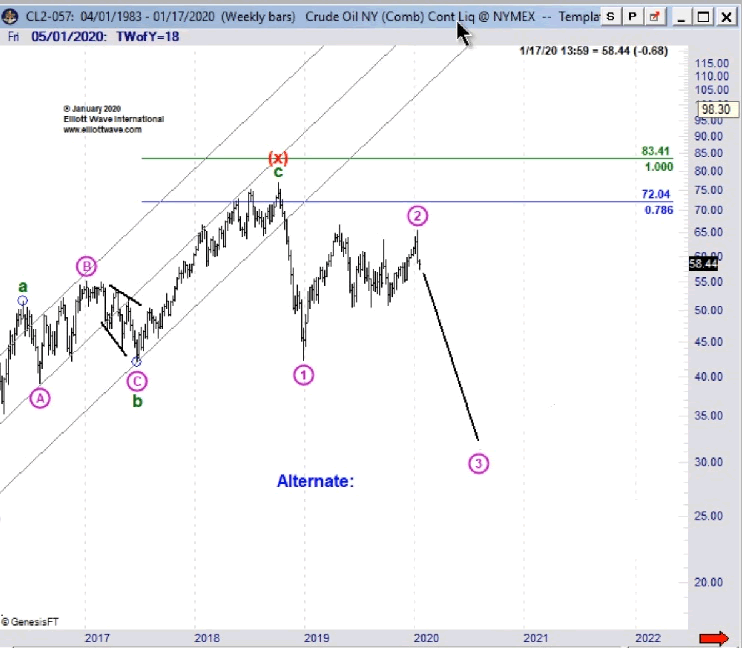
Note the timing of Jeffrey's January 17 bearish oil forecast. It occurred before the very first coronavirus travel restrictions were enforced on January 23, and before the OPEC+ "price war" began on March 6.
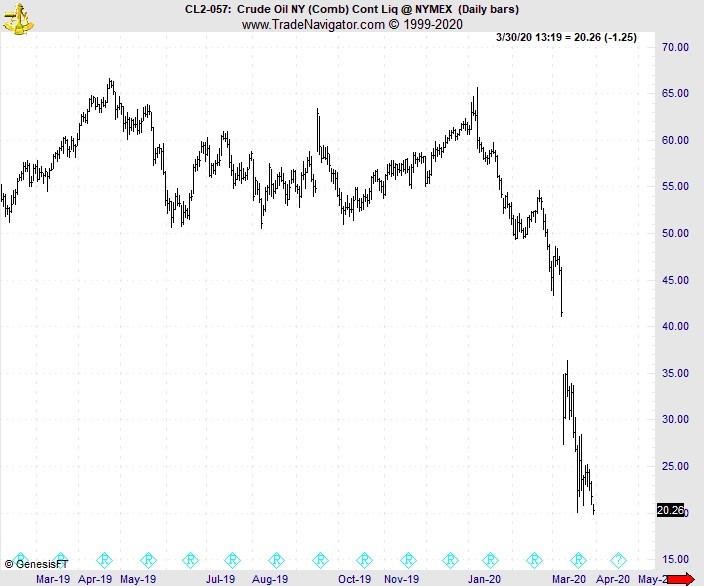
Soon after, on February 7, Jeffrey's near-term sister service Daily Commodity Junctures confirmed that oil's trend was now down and said,
"It's basically telling us that the high of the year is in place in crude oil and we will fall to $33 a barrel -- at minimum."
The next chart captures the action: Oil prices took the downside in earnest, plunging below $33 per barrel as anticipated by Jeffrey's January 17 bearish wave count.
The crude oil crash is just one real-world example of the danger of not having a methodology that leads trend changes, rather than follows them.
In his Trader's Classroom eBook "14 Critical Lessons Every Trader Should Know," Jeffrey expounds on all 5 "fatal flaws" of trading and offers original charts and lessons that stand the test of time.
In Jeffrey's words:
"Trading successfully is not easy. It's hard work...damn hard. And if anyone leads you to believe otherwise, run the other way, and fast.
"But this hard work can be rewarding, above-average gains are possible and the sense of satisfaction one feels after a few nice trades is absolutely priceless."
Get instant access to the complete, 45-page eBook today by joining the rapidly growing Club EWI community -- absolutely FREE. Get started now!
This article was syndicated by Elliott Wave International and was originally published under the headline . EWI is the world's largest market forecasting firm. Its staff of full-time analysts led by Chartered Market Technician Robert Prechter provides 24-hour-a-day market analysis to institutional and private investors around the world.
© 2005-2022 http://www.MarketOracle.co.uk - The Market Oracle is a FREE Daily Financial Markets Analysis & Forecasting online publication.