Dow Stock Market Crash Watch
Stock-Markets / Stock Markets 2020 Mar 08, 2020 - 07:01 PM GMTBy: readtheticker
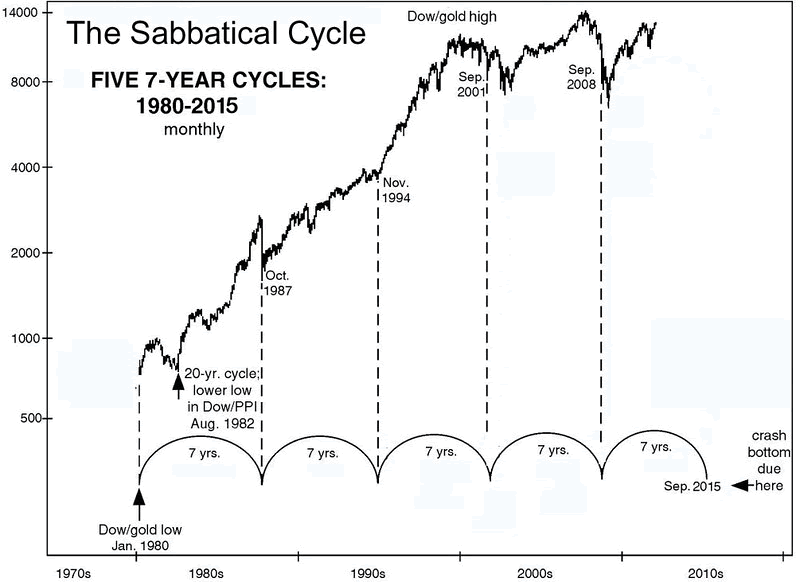
This is now on the table. Let us review three prior Dow volatility shocks. But first let us remind you of the Sabbatical Cycle (previous post Shemitah Study) Re post of the 7 year cycle chart below. Take 2015 add on 7 equals 2022, which suggests if a bear market does a occur a low maybe found in 2022. In 2015 we had a 12% sell off just prior to the 2016 US elections.
- Tariffs, trade War
- c19 Virus supply chain attack
- Central banks out of ammo (unless they change the rules: FED to buy stocks)
- Russia/Saudi oil price war (to attack US Shale).
Bubbles waiting for the pin:
- World Wide corporate debt
- World wide sovereign debt
- World wide Housing market
- US student loan debt
- US shale debt (part of corporate debt)
- Market leading stocks priced to perfection (Apple, Microsoft, Amazon, Google, Facebook)
- Passive investing via ETFs (including, stock, debt and volatility ETFs)
- High Frequency Trading (Algo's work on the way up and down)
- Central bank balance sheets
- Wall street financial engineering (CDOs, COCOs)
- Zombie Banks (DB, HSBC)
Just to name a few. Of course the need for cash will explode and contagion selling will occur. Please notice how GOLD is not acting like it did in the 2008 GFC crisis. Gold may escape contagion selling, and what does that tell you.
Click for popup. Clear your browser cache if image is not showing.
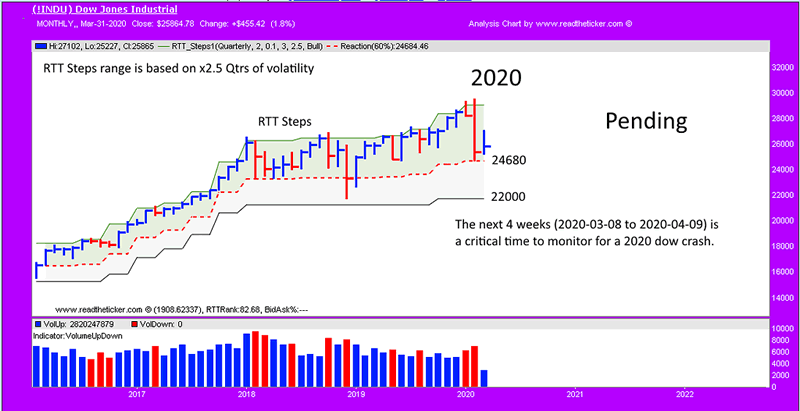
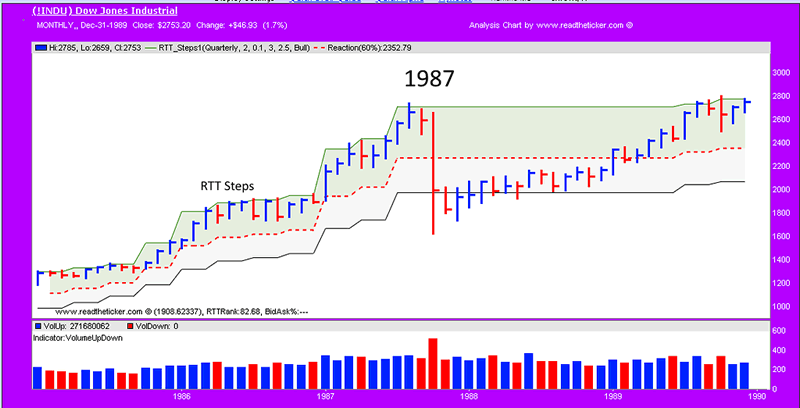
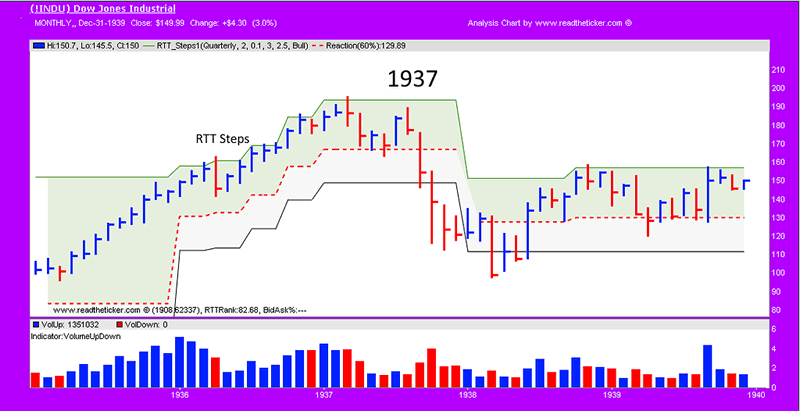
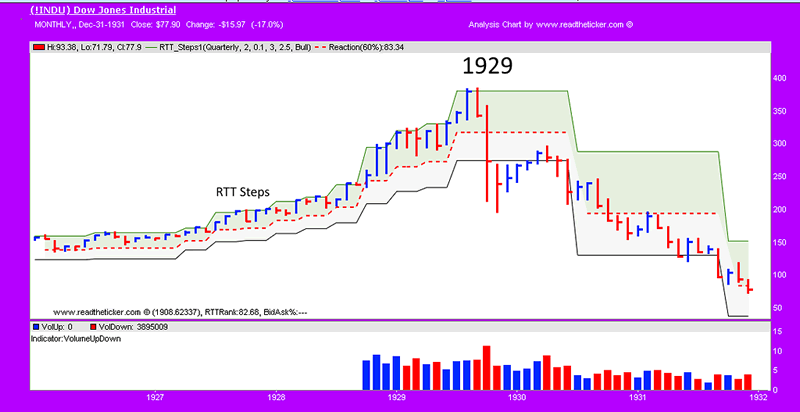
Fundamentals are important, and so is market timing, here at readtheticker.com we believe a combination of Gann Angles, Cycles, Wyckoff and Ney logic is the best way to secure better timing than most, after all these methods have been used successfully for 70+ years. To help you applying Richard Wyckoff and Richard Ney logic a wealth of knowledge is available via our RTT Plus membership. NOTE: readtheticker.com does allow users to load objects and text on charts, however some annotations are by a free third party image tool named Paint.net Investing
NOTE: readtheticker.com does allow users to load objects and text on charts, however some annotations are by a free third party image tool named Paint.net
Readtheticker
My website: www.readtheticker.com
We are financial market enthusiast using methods expressed by the Gann, Hurst and Wyckoff with a few of our own proprietary tools. Readtheticker.com provides online stock and index charts with commentary. We are not brokers, bankers, financial planners, hedge fund traders or investment advisors, we are private investors
© 2020 Copyright readtheticker - All Rights Reserved
Disclaimer: The material is presented for educational purposes only and may contain errors or omissions and are subject to change without notice. Readtheticker.com (or 'RTT') members and or associates are NOT responsible for any actions you may take on any comments, advice,annotations or advertisement presented in this content. This material is not presented to be a recommendation to buy or sell any financial instrument (including but not limited to stocks, forex, options, bonds or futures, on any exchange in the world) or as 'investment advice'. Readtheticker.com members may have a position in any company or security mentioned herein.
© 2005-2022 http://www.MarketOracle.co.uk - The Market Oracle is a FREE Daily Financial Markets Analysis & Forecasting online publication.


