


US Fed Panics – Stock Market Predictive Modeling Shows You What’s Next
Stock-Markets / Stock Markets 2020 Mar 06, 2020 - 12:00 PM GMTBy: Chris_Vermeulen

March 3, 2020: the US Fed issued an emergency rate cut of 0.50% to move rates to levels near 1.0% as a result of global economic concerns related to the spread of the Coronavirus and the potential damage it may do to the global major economies. President Trump had been suggesting the US Fed needed to be ahead of the risks associated with future market expectations to allow for increased liquidity and global economic function. Yet, we believe this move by the US Fed came at the wrong time for most investors and traders.
The global markets had already begun a process of revaluing risk in the markets near the end of February 2020. After the Q1 earnings data was digested and the newest Chinese data became available, investors suddenly understood the risks that we had been warning about for most of January and February. Suddenly, the US markets collapsed and traders were revaluing forward expectations.
Now that the US Fed has engaged in a 0.50% rate cut, the real risk solidifies in investor minds as “hey, the Fed is acting in a manner to ease money supply in preparation for a broad global slowdown”. What does this mean for skilled traders? We’ll explore the future price action using our Adaptive Dynamic Learning modeling system.
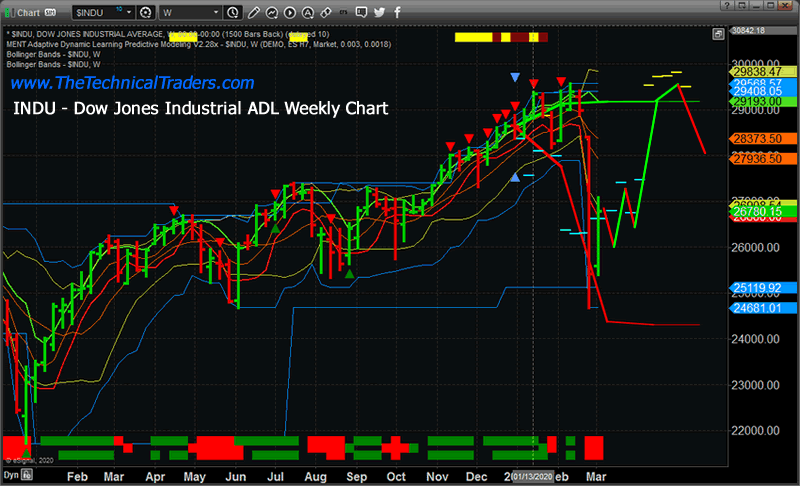
DOW JONES Weekly Chart
This INDU Weekly chart showing the ADL predictive modeling system results suggests the INDU will likely rotate near current lows (near 27,000) with very high volatility. Current volatility ranges on the INDU suggest the US markets could rotate 1000 points a day very easily over the next few weeks. Near early April, our ADL modeling system is suggesting the INDU will attempt to rally back to near 29,500 setting up a potential Double-Top formation. Our earlier research suggests the INDU/YM will likely form a bottom well before the S&P and NASDAQ – so this aligns with our earlier research.
Once the Double-Top sets up – all bets are off as risk will be extremely high for another breakdown event. We believe a true bottom will form/setup sometime between May and June 2020. Therefore, any recovery in the INDU to levels near 29,500 before the end of April would strongly suggest the markets are setting up for a Q1 earnings collapse – and a potential for a much deeper price low to set up as a real bottom.
Nasdaq Weekly Chart
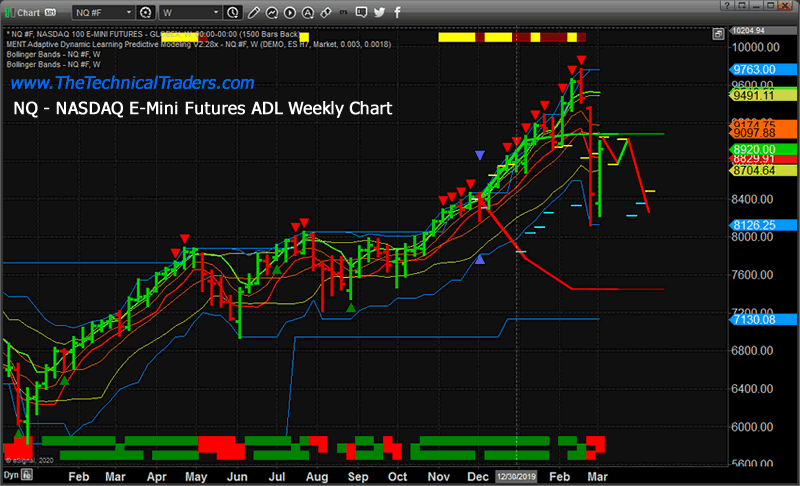
This NQ Weekly Chart highlights a shorter-term ADL projected price outcome. The reason we went further back in time to produce these results is because these ADL results aligned with price quite efficiently and also illustrated the perceived weakness in price throughout the end of 2019. Notice the CYAN DASH lines below the price in December 2019 – these are the ADL predictive price levels for that span of time. Near the early January 2020 price bars, the ADL predictive modeling system identified price levels that almost mirrored the NQ price activity. Currently, the ADL system is predicting the NQ will find temporary support near 9000 for a few weeks before breaking lower to levels near 8000~8200.
This price move, which is opposite that of the INDU, suggests the tech-heavy NASDAQ may continue to experience price pressure with a potential for a downside “waterfall” price event setting up.
Transportation Weekly Chart
Lastly, this TRAN (Transportation Index) Weekly chart highlights was we believe to be a more true valuation event setting up over the next 60 to 90+ days. This ADL chart suggests the TRAN price will almost immediately move back to levels near 11,000 (with a potential for a new high print above 11,300), then consolidate near 10,800 before breaking lower in late April or early May. This type of price action aligns with the Q1 results reflecting an economic contraction while optimistic investors attempt to push price levels back towards recent highs before the reality sets into the markets. The real forward expectations of Q2-2020 and Q3-2020 may be a fraction of levels reported for Q4-2019.
![]()
The US Fed is attempting to front-load the global markets with easier monetary policy to allow for unknown risks that may span 6 months out or longer. Our researchers believe the US stock market will set up a major bottom sometime between May and June 2020 (possibly a bit later) and from that point we expect the US markets to begin to move gradually higher. We believe this move will be similar to the downside price collapse that happened in January 2018 when the markets formed a clear Double-Bottom and began to move higher after May 2018 – eventually peaking above all-time highs.
Although the Fed fired an emergency rate cut of -0.50%, the reality is that investors may see this as a “miss” in terms of hitting a target. Yes, it eases capital flows and sets investor expectations to believe the US Fed is prepared for this risk – but it also diminishes the potential for the US Fed to take decisive action in Q2 or Q3 of 2020 if the markets collapse as we expect.
As we’ve been saying for many months, 2020 is sure to be an incredible year for skilled traders. Pay attention to our research to prepare for the biggest moves in the markets.
As a technical analysis and trader since 1997, I have been through a few bull/bear market cycles. I believe I have a good pulse on the market and timing key turning points for both short-term swing trading and long-term investment capital. The opportunities are massive/life-changing if handled properly.
As a technical analysis and trader since 1997, I have been through a few bull/bear market cycles. I believe I have a good pulse on the market and timing key turning points for both short-term swing trading and long-term investment capital. The opportunities are massive/life-changing if handled properly.
I urge you visit my ETF Wealth Building Newsletter and if you like what I offer, join me with the 1-year subscription to lock in the lowest rate possible and ride my coattails as I navigate these financial market and build wealth while others lose nearly everything they own during the next financial crisis. Join Now and Get a Free 1oz Silver Bar!
Chris Vermeulen
www.TheTechnicalTraders.com
Chris Vermeulen has been involved in the markets since 1997 and is the founder of Technical Traders Ltd. He is an internationally recognized technical analyst, trader, and is the author of the book: 7 Steps to Win With Logic
Through years of research, trading and helping individual traders around the world. He learned that many traders have great trading ideas, but they lack one thing, they struggle to execute trades in a systematic way for consistent results. Chris helps educate traders with a three-hour video course that can change your trading results for the better.
His mission is to help his clients boost their trading performance while reducing market exposure and portfolio volatility.
He is a regular speaker on HoweStreet.com, and the FinancialSurvivorNetwork radio shows. Chris was also featured on the cover of AmalgaTrader Magazine, and contributes articles to several leading financial hubs like MarketOracle.co.uk
Disclaimer: Nothing in this report should be construed as a solicitation to buy or sell any securities mentioned. Technical Traders Ltd., its owners and the author of this report are not registered broker-dealers or financial advisors. Before investing in any securities, you should consult with your financial advisor and a registered broker-dealer. Never make an investment based solely on what you read in an online or printed report, including this report, especially if the investment involves a small, thinly-traded company that isn’t well known. Technical Traders Ltd. and the author of this report has been paid by Cardiff Energy Corp. In addition, the author owns shares of Cardiff Energy Corp. and would also benefit from volume and price appreciation of its stock. The information provided here within should not be construed as a financial analysis but rather as an advertisement. The author’s views and opinions regarding the companies featured in reports are his own views and are based on information that he has researched independently and has received, which the author assumes to be reliable. Technical Traders Ltd. and the author of this report do not guarantee the accuracy, completeness, or usefulness of any content of this report, nor its fitness for any particular purpose. Lastly, the author does not guarantee that any of the companies mentioned in the reports will perform as expected, and any comparisons made to other companies may not be valid or come into effect.
Chris Vermeulen Archive |
© 2005-2022 http://www.MarketOracle.co.uk - The Market Oracle is a FREE Daily Financial Markets Analysis & Forecasting online publication.