


Stocks & Commodity Markets Elliott Wave Analysis - Show me the money!
Stock-Markets / Elliott Wave Theory Apr 01, 2007 - 05:06 PM GMTBy: Dominick

Surprise, surprise, another volatile week. The bears got their big selloff, but it was in corn, not in the S&P's! Corn opened down lock limit as the S&P's created great trading opportunities for the “unbiased” trader.
As we ended 2006, I promised 2007 would be the year of volatility, and hasn't that been the truth?! It feels like only yesterday we were grinding up each day point by point. Friday's closing bell wrapped up March, as well as the first quarter, but investors who were pegged to the S&P are in for a surprise when they receive their quarterly statements. The S&P closed 2 points from its 2006 close.
I'm sure many traders did better, but I'm also sure many are in the red this year. After all the juicy swings we've seen so far, that can only happen by being with the “in crowd” and following the wrong sentiment all over town. In January and February, bulls stayed too long and bears shorted too early. As we fell from the diagonal, Bulls bought back too early and bears stayed too late. Meanwhile, unbiased traders are making money on both ends.
But not only did the bears stay short too long when the market turned back up recently, they've been buying puts everyday as the S&P's retrace a full 75% off the lows. Traders have been playing this broken record for the last 4 years! Isn't this setup played out by now? Sure, this could be the real one, but why give back 75% when we have no confirmation yet?
Since March 14 th , where we saw our SPX 1360 area validated, it's been a challenge to educate our rapidly growing number of new members. Old members who've successfully made the transition from bear to trader are just fine. Many new members still seem to want to follow the crowd and are having a tough time because the streets are filled with “crash” counts. I can't really blame them as it's a hard sentiment to escape from. That said, they are also starting to recognize that going long from 1360's to 1440 also makes your portfolio grow rapidly. Don't get me wrong, I'll be on the bearish side as soon as I see the market grow some fur, but not before that.
A good case in point for the bear camp was the drop in February. Readers all knew that I had an S&P target 1462/1470 and was ready to short it, but not before confirmation. After getting short close to the top, I sensed that a low was being built in March, rather than a trapdoor for continuation of the drop. This week, we might have the same situation, but on a smaller degree. Has the market topped out in a second wave retracement on March 23 rd , or are we about to set a huge bear trap to finally get that run to new highs that sets up the classic capitulation?
As we've basically nailed these last two swings, we think we have the correct possible patterns and are waiting for a bit more price action to confirm. It might only take another day or two . I believe we have a decent move from here that starts the new trend, or ends the old. We are ready to take that trade which is probably within the next 20 points.
Let's talk a bit about last week. I had stated the following on last week's update:
“Next week we have some work to do in the short term patterns. We should've already seen a pullback, but the market still has a bid from trapped shorts. My short term trend charts have already weakened”
The market wasted no time in dropping a big 13 points in the first hour of the week. Expecting that drop, as a 4 th wave pattern, we were able to go long the bottom as it screamed to the upside, escaping another bear trap. From that high, the shorts were able to trap bulls into thinking that a triangle 4 th wave was forming and used Bernanke's speech to execute. I also had that same triangle and unfortunately missed the selloff into the speech but as “traders”, we then got back aboard that low which almost made it back up to another high.
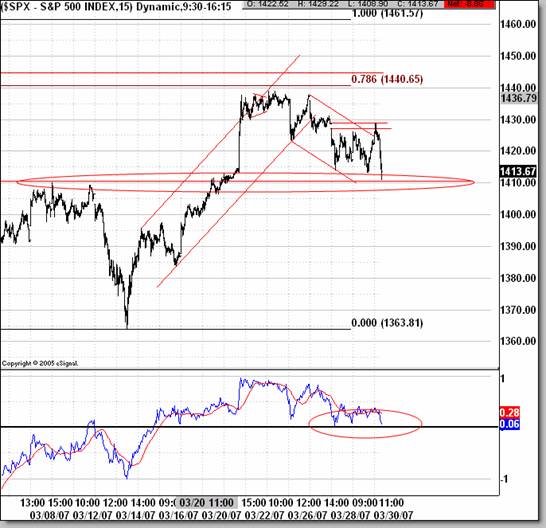
And boy did we trade this week! 10-15 point swings are now almost a sure thing. With the aid of my Proprietary Fibonacci methods, we were able to zone into targets that were 1 tick away of highs and lows of a fast-moving market. One example was a low target of 1423 on Thursday (actual low was 1423.25) and resistance at 1440 on Friday (actual high was 1439.75). Friday morning's pre-market post had warned that 1440 was a key area and that stopping there could be a problem. The S&P futures seemed to know that. After a gap up, they reversed to sell off into a low of 1418. Those 2 swings alone totaled 38 points, and prove how much there is to take from a market that closed flat for the day, and the year!
As most traders sold into what looked to be the start of a 3 rd of a 3 rd of a 3 rd , this chart was posted right off the lows showing a simple test of prior break out. Price jumped off that low to close up 11 points away from it.
I hate to sound like I'm making fun of the bearish case as I'm looking forward to trading it as much as the next trader, but so far the bears are losing the fight once again. There still is another day or so to have their way but as one of our seasoned traders posted,
“After the alleged completed wave 2, prices should have declined sharply in clearly impulsive fashion. THEY DID NOT. There is no way that one can reasonably count the decline from the 12511.0 high of March 23 as either an initial "five" or even part of one. For now, the drop from that high appears best counted as a corrective "triple three" to today's low. As long as last week's high remains intact, however, I agree that this is the best shot the bears have.”
I agree 100% with that statement, and if the bears cant “show me the money” by early next week, we have better plans for the market.
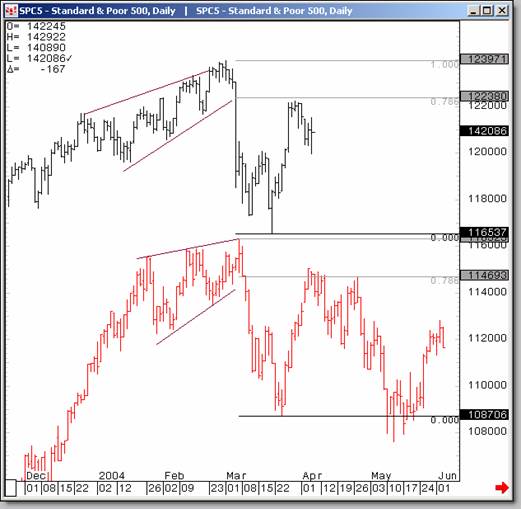
Last week I included a chart that showed an analog that we had been following.
Below is the updated chart that has served us well since December. If we get confirmation of a certain pattern early next week, we may put this chart on the back burner and concentrate on a better idea. But in the meantime:
Another statement I made last week was:
I will simply caution that once we see the market validate our suspected patterns, we'll be preparing for more violent moves in the future. I will also be cautioning our day traders about going home with positions.
I want to reiterate that statement this week as we are far from calming down.
As you saw this week, both volatility and gaps are here to stay, so be careful. With that said, I'm not sure if we still need a retest or lower low of Fridays action before turning back up if the bearish case is dead. I would like to see that happen, but also willing to chase it up if I have confirmation. Doesn't matter anyway, this market is full of points for the “Unbiased” Elliott Wave” trader. In last weeks update I mentioned we had a possible important date around April 9 th . Keep that in mind along with the Island in the S&P that I had showed, in case the bears lose the fight here. If the bearish case has begun, you will know sooner than you think!
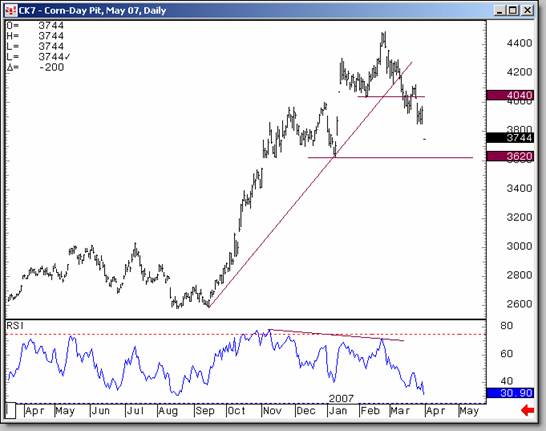
Grains
Earlier I mentioned the lock limit down in corn. We had been waiting for that for some time now as we had a nice setup.
Oil
Crude shot up to its highest levels since December this week. Remember when the talk was about oil in the $30's, except for me, who was telling you to expect mid $60's again? Well, here we are. No doubt some buyers were getting in this week on the news coming out of Iran . While this situation can honestly go either way from here, it'll probably be awhile before any new escalations, so there's a good chance oil settles back down a bit.
Members Only
Last week I mentioned:
“This week will give us a lot of information as we wait for the results of this small consolidation”
The S&P's wasted no time early last week to break down from that consolidation and we got our awaited volatility. I'm sure you all know what the charts have a potential of saying pretty soon, but to be perfectly “unbiased” I must give the bear a chance to “show me the money”.
Otherwise, use the link below to see 2 excellent possibilities as others scramble. Good luck next week and be careful. Being flat overnight isn't a bad idea until we have confirmation.
To Current and Prospective Members:
There will not be a Market Update for the week ending April 6, as I finally take a day off and celebrate the Easter holiday.
TTC will also be increasing it monthly subscription fee sometime before this summer. The increase has become inevitable due to our ongoing expansion of the Website, computer and software upgrades, and the addition of services such as trend cycle charts. Current members and anyone that joins before the increase takes effect will not be subject to the new price, and will continue paying the current $50 subscription fee on a month-to-month basis. So if you have been thinking of joining, this might be a great time.
Thank you for your attention to these changes. If there are any questions, please direct your email to admin@tradingthecharts.com.
Have a profitable, and safe week trading, and remember:
“Unbiased Elliott Wave works!”
By Dominick
For real-time analysis, become a member for only $50
If you've enjoyed this article, signup for Market Updates , our monthly newsletter, and, for more immediate analysis and market reaction, view my work and the charts exchanged between our seasoned traders in TradingtheCharts forum . Continued success has inspired expansion of the “open access to non subscribers” forums, and our Market Advisory members and I have agreed to post our work in these forums periodically. Explore services from Wall Street's best, including Jim Curry, Tim Ords, Glen Neely, Richard Rhodes, Andre Gratian, Bob Carver, Eric Hadik, Chartsedge, Elliott today, Stock Barometer, Harry Boxer, Mike Paulenoff and others. Try them all, subscribe to the ones that suit your style, and accelerate your trading profits! These forums are on the top of the homepage at Trading the Charts. Market analysts are always welcome to contribute to the Forum or newsletter. Email me @ Dominick@tradingthecharts.com if you have any interest.
This update is provided as general information and is not an investment recommendation. TTC accepts no liability whatsoever for any losses resulting from action taken based on the contents of its charts, commentaries, or price data. Securities and commodities markets involve inherent risk and not all positions are suitable for each individual. Check with your licensed financial advisor or broker prior to taking any action.
© 2005-2022 http://www.MarketOracle.co.uk - The Market Oracle is a FREE Daily Financial Markets Analysis & Forecasting online publication.