


Stock Market January 2018 Repeats in 2020 – Yikes!
Stock-Markets / Stock Markets 2020 Jan 24, 2020 - 06:31 PM GMTBy: Chris_Vermeulen

Our research team caught a very interesting price pattern that correlates with the Put/Call ratio. We are alerting our friends and followers with this research post of this exciting, yet unconfirmed, set up today.
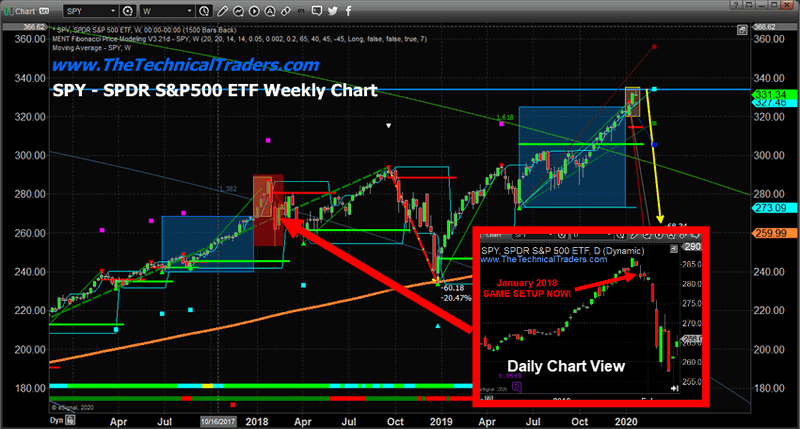
In late 2017, the US stock market rallied from July through December with moderately low volatility throughout this span of time. Near the end of 2017, the US stock market price activity stalled, then began a renewed price rally in early 2018 (see the first BLUE & YELLOW BOX on the chart below). Then, in January 2018, a very broad market reversion event took place which ultimately resulted in a very broad market correction in October through December 2018 of just over 20%.
The current price rally ending 2019 and starting 2020 is strangely similar to the price setup that occurred in 2017 and 2018. We’ve seen a broad “melt-up” price pattern over the last 5+ months of 2019 with moderately low volatility. We experienced a moderate price “stall” near the end of 2019 and experienced a broader renewed upside price rally in early 2020 (see the second BLUE and YELLOW BOX on the chart below). We believe this could be a setup for a potential price reversion event in the near future – all we need is confirmation of the downside price rotation to take place.
A deeper price reversion event at this price level that equals the previous reversion event would push the SPY price towards the $265 price level – a 68 point price drop. If such an event took place, we would be looking at a -15% to -25% potential price correction from current levels.
Let’s take a look at other charts and data that may confirm our research…
Weekly SPY (S&P 500) Index Chart – Jan 2018 and Jan 2020
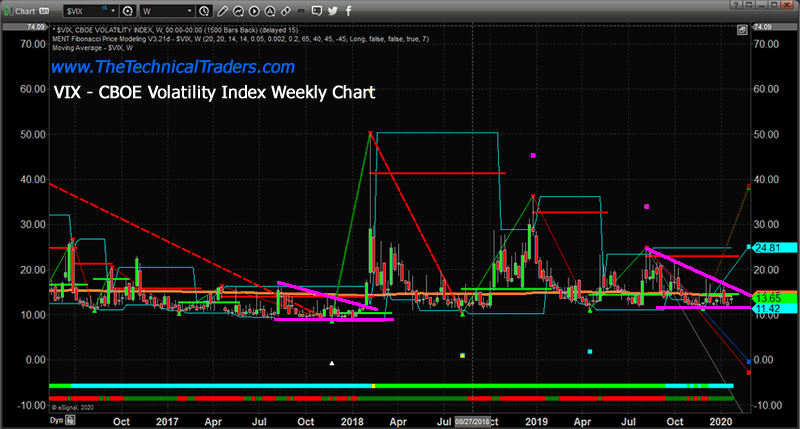
Weekly VIX Chart
This Weekly VIX chart highlights the consolidation of volatility that set up in late 2017 and late 2019. Pay special attention to how broadly the VIX spiked in early 2018. This spike happened because of the consolidation of volatility near lower extremes over the past 16+ months. Given the recent volatility throughout 2018 and 2018, a downside price move of a similar range would likely propel the VIX to levels above 40~45. Price would need to collapse below our expected range in order for VIX to spike above 50. A move of this nature would suggest a downside price move beyond 25% to 30% – pushing the SPY below $240.
Again, our research team believes this is an unconfirmed price pattern setup. We want you to be aware of what we are seeing in the chart and be prepared if it confirms in the future.
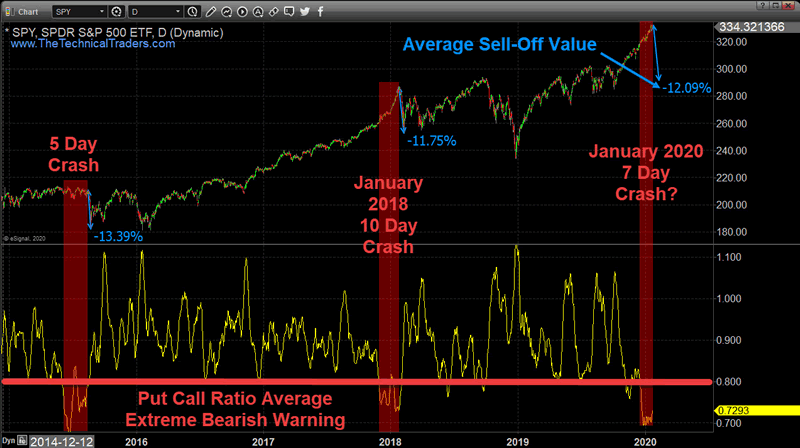
Daily Put/Call Ratio Chart
Another interesting aspect of this setup is the correlation to the PUT/CALL ratio on the chart below. Every instance of the Put/Call ratio that fell below 0.80 for an extended period of time (2014, 2018 and now), prompted a downside price reversion of -10% to -15%. Additionally, each instance of this setup (2014 and 2018) prompted an extended period of price volatility and rotation.
In 2014, the initial downside price reversion prompted a -13% to -15% price correction followed by nearly 8 to 10 months of extended price rotation before finally entering a new bullish price trend in late 2016. Additionally, in 2018, the initial downside price reversion event wiped out nearly 12% of the value on the initial downside price move from this event. Subsequently, over the next 12+ months, a second downside price move wiped out over 20% of the value from the SPY.
The current setup suggests any potential downside price reversion resulting from this setup we are alerting you to could easily target -12% to -15% on an initial reversion event. Ultimately, the rest of 2020 could result in a very volatile year of price rotation if history teaches us anything.
Remember, this is not a confirmed trading trigger. This is a warning that a price and technical setup is occurring in the markets that may become of real value to you in the immediate future. The combination of these three charts, the SPY, the VIX and the PUT/CALL ratio, should be enough for you to understand there are real risks of a price reversion event setting up in the markets right now. All we need to confirm this setup would be for a broader market breakdown event to begin to take place. Then, we would watch what happens to the SPY near the $295 to $300 level.
Please pay attention to this setup as our researchers believe this could be a much bigger event than many people believe. Our research team believes a price reversion event is essential for the US stock market to continue to climb higher in 2020. Thus, some type of downside price move MUST happen before we can attempt any further upside price advancement.
As a technical analysis and trader since 1997 I have been through a few bull/bear market cycles, I have a good pulse on the market and timing key turning points for both short-term swing trading and long-term investment capital. The opportunities are massive/life-changing if handled properly.
Join my Wealth Building Newsletter if you like what you read here and ride my coattails as I navigate these financial markets and build wealth while others lose nearly everything they own.
Chris Vermeulen
www.TheTechnicalTraders.com
Chris Vermeulen has been involved in the markets since 1997 and is the founder of Technical Traders Ltd. He is an internationally recognized technical analyst, trader, and is the author of the book: 7 Steps to Win With Logic
Through years of research, trading and helping individual traders around the world. He learned that many traders have great trading ideas, but they lack one thing, they struggle to execute trades in a systematic way for consistent results. Chris helps educate traders with a three-hour video course that can change your trading results for the better.
His mission is to help his clients boost their trading performance while reducing market exposure and portfolio volatility.
He is a regular speaker on HoweStreet.com, and the FinancialSurvivorNetwork radio shows. Chris was also featured on the cover of AmalgaTrader Magazine, and contributes articles to several leading financial hubs like MarketOracle.co.uk
Disclaimer: Nothing in this report should be construed as a solicitation to buy or sell any securities mentioned. Technical Traders Ltd., its owners and the author of this report are not registered broker-dealers or financial advisors. Before investing in any securities, you should consult with your financial advisor and a registered broker-dealer. Never make an investment based solely on what you read in an online or printed report, including this report, especially if the investment involves a small, thinly-traded company that isn’t well known. Technical Traders Ltd. and the author of this report has been paid by Cardiff Energy Corp. In addition, the author owns shares of Cardiff Energy Corp. and would also benefit from volume and price appreciation of its stock. The information provided here within should not be construed as a financial analysis but rather as an advertisement. The author’s views and opinions regarding the companies featured in reports are his own views and are based on information that he has researched independently and has received, which the author assumes to be reliable. Technical Traders Ltd. and the author of this report do not guarantee the accuracy, completeness, or usefulness of any content of this report, nor its fitness for any particular purpose. Lastly, the author does not guarantee that any of the companies mentioned in the reports will perform as expected, and any comparisons made to other companies may not be valid or come into effect.
Chris Vermeulen Archive |
© 2005-2022 http://www.MarketOracle.co.uk - The Market Oracle is a FREE Daily Financial Markets Analysis & Forecasting online publication.