


Stock Market Festivus
Stock-Markets / Stock Markets 2019 Dec 27, 2019 - 07:11 AM GMTBy: Gary_Tanashian

They say that Festivus is the “anti-Christmas”, but in this case we are going to call it the anti-Christmas Eve as the markets close out 2019’s Christmas Eve massacre.
“Many Christmases ago I went to buy a doll for my son. I reached for the last one they had, but so did another man. As I rained blows upon him I realized there had to be another way!”
This year markets are going another way.
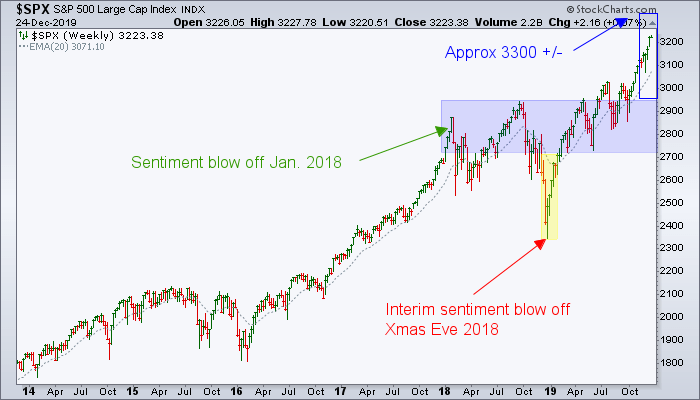
We have been managing a potential Christmas Eve close-out sale in the stock market since SPX hopped the Bull Turnstile, negating topping potential and confirming bullish ascending triangles (not shown below as they appeared on daily charts) and its own major trends by breaking upward. Here is the most recent chart (from NFTRH 582) used to illustrate the situation.
Please consider this weekly chart for reference only. We had a lot of words in #582 about what I think is in play, but ultimately this public post is simply illustrating what is currently in play. And that is an upside extension (with associated sentiment readings to be updated this weekend in NFTRH 583) that would be roughly equal and opposite to the 2018 downside blow off (note: though the chart allows for higher levels, SPX has already qualified for a price and sentiment close-out, in the general spirit of the season). The blue box is the same height as the yellow shaded area. It’s more art than TA, but there you have it… some frame of reference.
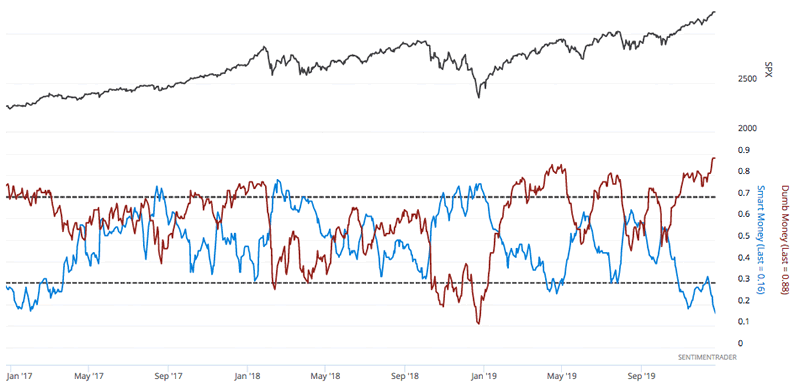
While we will have a fuller sentiment review in NFTRH 583 this weekend, one look at Sentimentrader‘s Smart/Dumb money indicator positioning confirms what we have been expecting, which is new price highs amid a new (albeit secondary to the 2018 sentiment frenzy) sentiment blow off. This is an ugly picture to a contrarian investor.
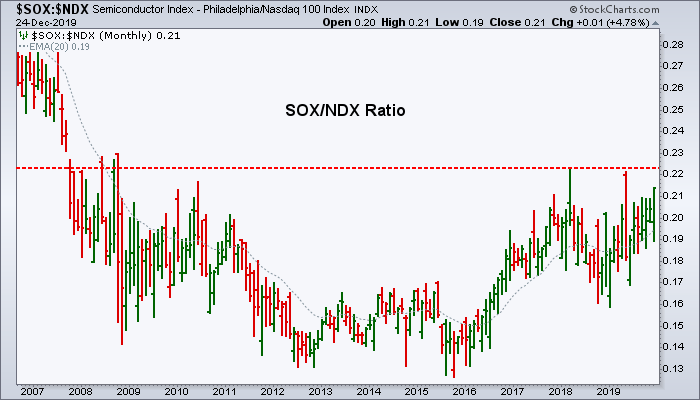
This has been our leading (bull) indicator for all of 2019. The SOX/NDX ratio is the lead end of the SOX>NDX>SPX leadership chain we’ve watched and respected all year long in managing the bull trends (Semiconductor Leadership Has 1 Year Birthday – Nov. 2019).
It is either a bullish base or an ending situation at key resistance. One thing I do know is that we have been bullish on the Semis for most of 2019 amid the sound of crickets. Today I am reading all over the financial media about how bullish the Semi sector is (and sentiment does include reputable research, so I am not trying to be a contrarian wise guy: Ref. The Tide Has Turned at SEMI).
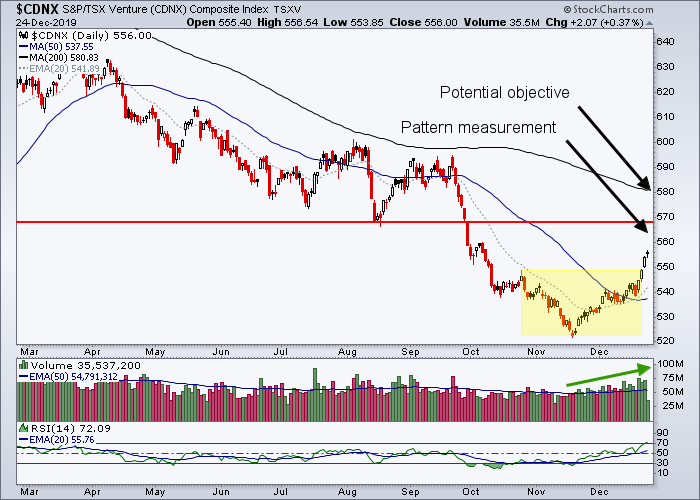
Meanwhile, animal spirits are in play and the process will terminate when it terminates. But I think the lower volume ‘Santa’ season () can generally fit the bill. One thing to keep an eye on is the commodity and resources areas, which we’ve been riding for a good bottom and bounce (note the word “bounce”, which does not mean bull market). Below is the chart (now updated with further bullish price action) that caught our attention last weekend.
We have had the TSX-V on watch all along and more intently since it bottomed with an RSI divergence in November. In climbing above the SMA 50 and forming a bounce pattern we then established targets, the first of which appears to be locked and loaded. Talk about tax loss season. This index of beaten down resources (oil & gas exploration, base & precious metals exploration, etc.) is making a classic seasonal picture.
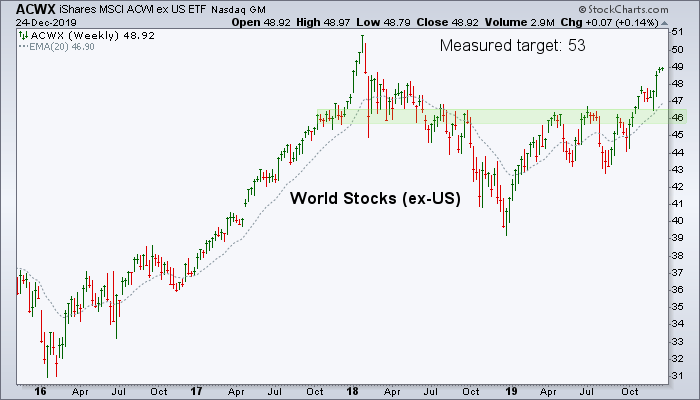
There is also the global picture to consider. The World (ex-US) has a measurement of its own that it will perhaps seek out. Here’s the weekly chart of ACWX.
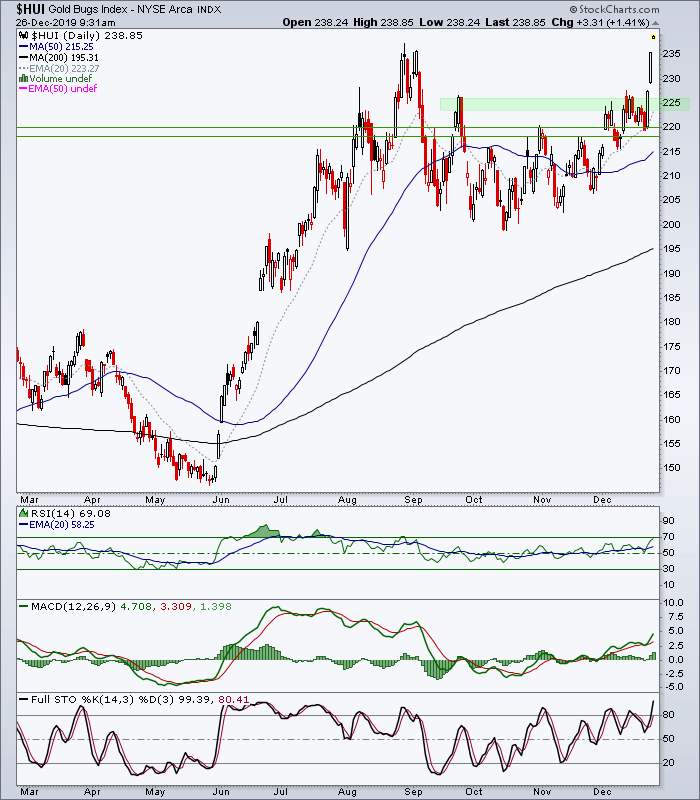
And finally, what kind of Festivus would it be without taking a look at the ‘anti’ market, AKA the counter-cyclical sector, which has been right there in party mode this season along with most everything else?
The daily chart of HUI (at the moment of posting breaking upward yet again today under cover of the Santa seasonal) never did fulfill worst-case yet normal correction expectations as the TA instructed us to give it the benefit of the doubt last week when it held the 220 area support (per an NFTRH update previous to that).
If/as HUI ticks a new high for the bull cycle it will confirm the up-trending moving averages and set a course for the upside targets we’ve had in play since June.
What I am liking best about this situation is that whether or not the true sector fundamentals play ball (they currently are not in very good shape as they continue to consolidate) historical HUI has shown the ability to travel to great heights against its fundamentals after a launch with its fundamentals. I like that in combination with the fact that our upside targets are pretty conservative and not even calling for a major new bull market, and yet there is a lot of potential upside ahead.
Still, the miners are rallying hard during the holiday seasonal party. There’s Wayne, there’s Garth and there’s you, me and Frank Costanzsa haranguing all the while.
Let’s try to figure out what is real and what is an illusion as the machines run the holiday muted show. Last year the market crash was not real. This year the market rally?? For most of this year I’ve been able to balance gold and silver mining positions against broad stock market positions as they were contrary or anti each other in a year-long Festivus of sound portfolio management.
Now however, at the doorway to 2020, it gets more interesting… and challenging.
Subscribe to NFTRH Premium (monthly at USD $35.00 or a discounted yearly at USD $365.00) for an in-depth weekly market report, interim market updates and NFTRH+ chart and trade setup ideas, all archived/posted at the site and delivered to your inbox.
You can also keep up to date with plenty of actionable public content at NFTRH.com by using the email form on the right sidebar and get even more by joining our free eLetter. Or follow via Twitter ;@BiiwiiNFTRH, StockTwits or RSS. Also check out the quality market writers at Biiwii.com.
By Gary Tanashian
© 2019 Copyright Gary Tanashian - All Rights Reserved
Disclaimer: The above is a matter of opinion provided for general information purposes only and is not intended as investment advice. Information and analysis above are derived from sources and utilising methods believed to be reliable, but we cannot accept responsibility for any losses you may incur as a result of this analysis. Individuals should consult with their personal financial advisors.
Gary Tanashian Archive |
© 2005-2022 http://www.MarketOracle.co.uk - The Market Oracle is a FREE Daily Financial Markets Analysis & Forecasting online publication.