


Stock Market 100% Measured Moves May Signal A Top
Stock-Markets / Stock Markets 2019 Nov 28, 2019 - 06:25 PM GMTBy: Chris_Vermeulen

One type of Fibonacci price structure we use to attempt to measure price trends and identify potential tops/bottoms is the “100% Measured Move” structure. This is a price structure where a previous price move is almost perfectly replicated in a subsequent price trend after a brief period of retracement or price correction. These types of patterns happen all the time in various forms across multitudes of symbols to create very solid trading signals for those that are capable of identifying trends and opportunities using this technique. If you want my daily analysis and trade ideas, be sure to get my updates by joining my free trend signals email list.
The first thing we look for is a strong price trend or the initially confirmed reversal of a price trend. We find that these trending price ranges and initial “impulse trends” tend to prompt 100% measured moves fairly accurately. The explosive middle-trend is where one can’t assume any type of Fibonacci 100% measured move will happen. Those explosive moves in a trend that tend to happen in the middle of a price trend are what we call the “expansion wave” of a trend and will typically be 160% or more the size of the initial impulse trend.
These trade setups we call the “100% measured moves” are naturally occurring price rotations that skilled traders can use to identify strong trade potential setups. They are more common in rotating markets where a moderate trend bias is in place (for example in the current YM or ES chart).
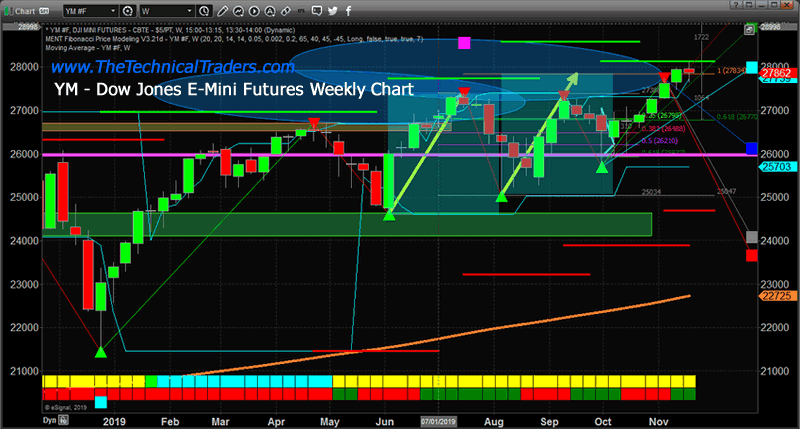
First, let’s take a look at this YM Weekly Chart to highlight the most recent 100% Measured Move. The original upside price move between June 2019 and July 2019 resulted in a 2787 point price rally that replicated between August 2019 and November 2019 – after a brief price retracement. Currently, price is rotating near the peak of this 100% measured price move near 27,875 while attempting to set up a new price trend.
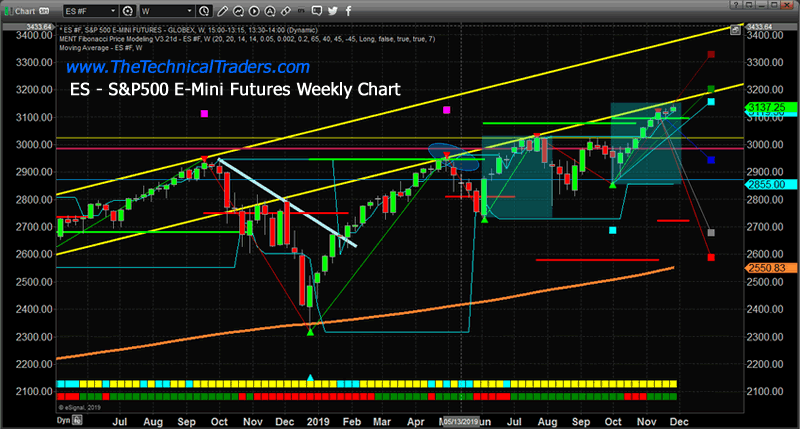
In this ES Weekly example chart, we see a 100% Measured Move that originated in June 2019 and ended in July 2019 – just like on the YM chart. Although the completion of the 100% measured move didn’t originate until the low that formed before price rallied to take out the previous high near 3029.50. Remember, the other facets of Fibonacci price theory are also still at play in the markets while these 100% Measured Moves are taking place. Thus, rotation between a previous price peak and valley (without establishing any new price highs or new price low) are considered “price rotation” – not trending. The 100% Measured Move that did take place recently did complete a full 100% advancement and is now stalling near the 3040 level peak.
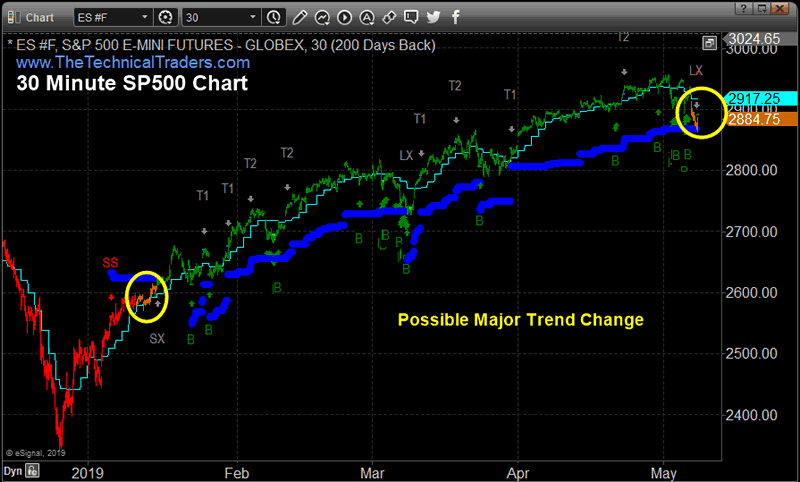
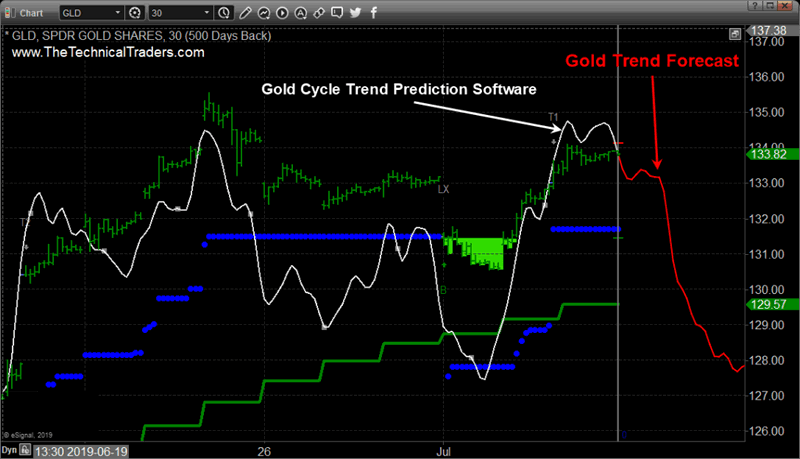
If you are not familiar with some of my forecasting and trading strategies for trading the S&P 500, or my gold trading signals be sure to click those links to see some pretty interesting charts like these.
SP500 Index Trend Identification and Trade Signal System
Cycle and Price Prediction System
Concluding Thoughts:
Once these 100% measured moves complete, price usually attempts to stall or wash out a bit before attempting to establish a new price trend. At this point, given the examples we’ve illustrated, we believe the US market will enter a period of rotation and moderate volatility as these 100% measured moves have completed the upside price advance for now. Some level of price rotation after these 100% measured moves have completed will potentially allow for another attempt at a future 100% price advance after setting up a new price leg.
These techniques don’t always work, we recently got stopped out on a TVIX (vix/volatility trade for a loss) but we just close out our thirst natural gas trade for a quick 7% profit. The previous UGAZ trade netted 20%, and the one before that was 7.95%.
I can tell you that huge moves are about to start unfolding not only in metals, but stocks, and currencies. Some of these supercycles are going to last years. Brad Matheny goes into great detail with his simple to understand charts and guide about this. His financial market research is one of a kind and a real eye-opener. PDF guide: 2020 Cycles – The Greatest Opportunity Of Your Lifetime
As a technical analysis and trader since 1997, I have been through a few bull/bear market cycles. I believe I have a good pulse on the market and timing key turning points for both short-term swing trading and long-term investment capital. The opportunities are massive/life-changing if handled properly.
I urge you to visit my Wealth Building Newsletter and if you like what I offer, join me with the 1 or 2-year subscription to lock in the lowest rate possible with our BLACK FRIDAY offer, PLUS get a FREE BAR OF GOLD and ride my coattails as I navigate these financial markets and build wealth while others lose nearly everything they own during the next set of crisis’.
Chris Vermeulen
www.TheTechnicalTraders.com
Chris Vermeulen has been involved in the markets since 1997 and is the founder of Technical Traders Ltd. He is an internationally recognized technical analyst, trader, and is the author of the book: 7 Steps to Win With Logic
Through years of research, trading and helping individual traders around the world. He learned that many traders have great trading ideas, but they lack one thing, they struggle to execute trades in a systematic way for consistent results. Chris helps educate traders with a three-hour video course that can change your trading results for the better.
His mission is to help his clients boost their trading performance while reducing market exposure and portfolio volatility.
He is a regular speaker on HoweStreet.com, and the FinancialSurvivorNetwork radio shows. Chris was also featured on the cover of AmalgaTrader Magazine, and contributes articles to several leading financial hubs like MarketOracle.co.uk
Disclaimer: Nothing in this report should be construed as a solicitation to buy or sell any securities mentioned. Technical Traders Ltd., its owners and the author of this report are not registered broker-dealers or financial advisors. Before investing in any securities, you should consult with your financial advisor and a registered broker-dealer. Never make an investment based solely on what you read in an online or printed report, including this report, especially if the investment involves a small, thinly-traded company that isn’t well known. Technical Traders Ltd. and the author of this report has been paid by Cardiff Energy Corp. In addition, the author owns shares of Cardiff Energy Corp. and would also benefit from volume and price appreciation of its stock. The information provided here within should not be construed as a financial analysis but rather as an advertisement. The author’s views and opinions regarding the companies featured in reports are his own views and are based on information that he has researched independently and has received, which the author assumes to be reliable. Technical Traders Ltd. and the author of this report do not guarantee the accuracy, completeness, or usefulness of any content of this report, nor its fitness for any particular purpose. Lastly, the author does not guarantee that any of the companies mentioned in the reports will perform as expected, and any comparisons made to other companies may not be valid or come into effect.
Chris Vermeulen Archive |
© 2005-2022 http://www.MarketOracle.co.uk - The Market Oracle is a FREE Daily Financial Markets Analysis & Forecasting online publication.