


Dow Jones Stock Market Cycle Update and are we there yet?
Stock-Markets / Cycles Analysis Nov 17, 2019 - 09:10 PM GMTBy: readtheticker

 Today the Dow and the SP500 are making new all time highs. However all long and strong bull markets end on a new all time high. Today no one knows how many new all time highs are to go, maybe 1 or 100+ more to go, who knows! So are we there yet? readtheticker.com combine market tools from Richard Wyckoff, Jim Hurst and William Gann to understand and forecast price action. In concept terms (in order), demand and supply, market cycles, and time to price analysis. Cycle are excellent to understand the wider picture, after all markets do not move in a straight line and bear markets do follow bull markets.
CHART 1: The Dow Jones Industrial average with the 900 period cycle.
A) Red Cycle: The 900 period cycle (or 880) is the dominate cycle in the Dow Jones.
B) Notice how the cycle low 1,2,3 and hash [#] is timed with market recession (in order): 1982, 1991, 2001, 2008 (out of sync). The last has a recession forecast for late 2020 or 2021 [a maybe].
C) CAUSE 1, CAUSE 2 and CAUSE 3 are the normal stepping stones of Richard Wyckoff cause and effect logic. Very typical price action: market rallies, consolidation, rallies, consolidation, you guess it, it rallies. Of course if a rally does not follow a consolidation then the 'cause and effect' confidence trend is broken. So far this is has not happened. This is why one can not be bearish to any strong degree, the bullish status quo continues.
D) RTT Momentum reflects price momentum relative to the cycle. The current position of momentum is elevated and bullish.
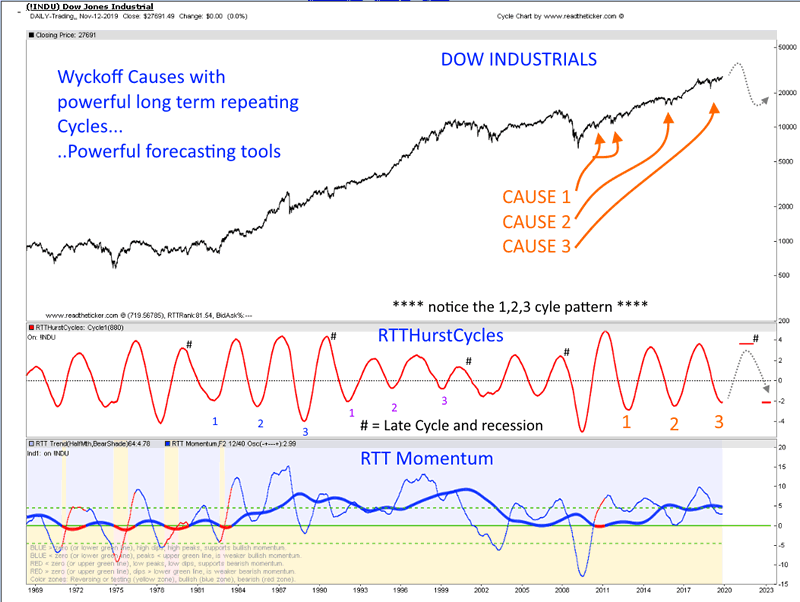
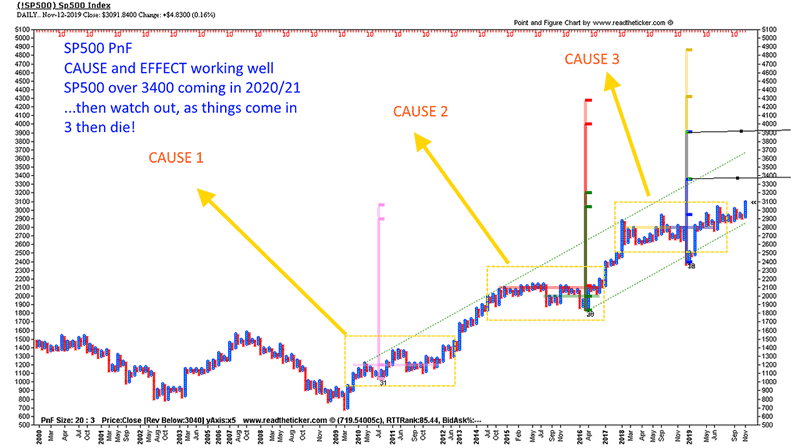
CHART 2: Below is the Richard Wyckoff Point and Figure 1 to 3 risk reward forecast.
A) As the above Dow Jones cycle suggest markets are still bullish, and CAUSE 3 forecast suggest the SP500 can reach at least 3,400
B) And why not, price has done this twice before.
The $64,000 dollar question is next.
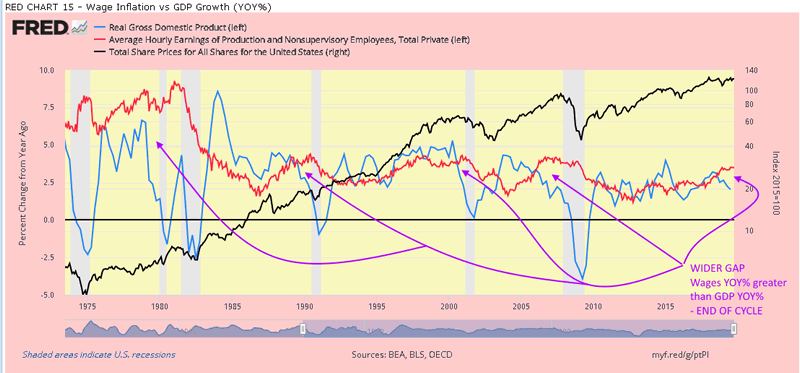
Question: Is the above cycle a mid or late cycle event? A late cycle event is when inflation trickles down to masses. In other words wage inflation is a late cycle event. Unfortunately since Nixon went off the gold standard it is a consistent situation just as the masses gain a wider wage increase a deflation event (recession) crushes the hard won pay increases.
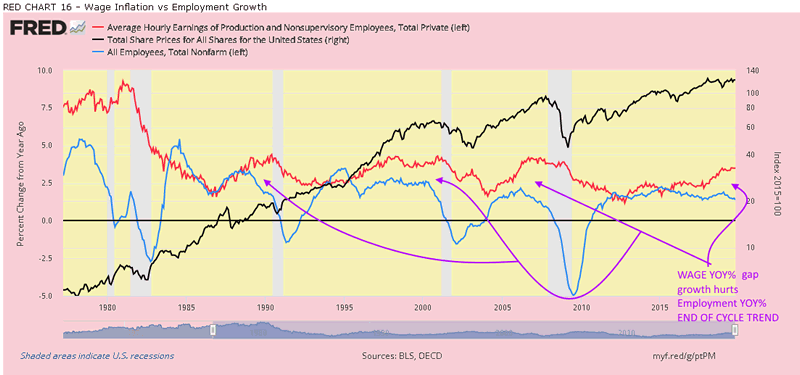
The next two charts confirm the late cycle event of wage inflation is occurring now.
CHART 3: When YOY% wage inflation is greater than GDP the labor element within the economy is becoming very expensive. This is because labor is scarce and hence wages increases. If labor is scarce and expensive it is unlikely the economy will enjoy high levels of production and hence GDP will continue to suffer and be very venerable to recession. The chart below supports the cycle is in the late stages.
Question: How long to go with the current cycle?
Ref: Consumers Are Keeping The US Out Of Recession? Don’t Count On It.
This extract answers the question exactly
Just recently, Jeffry Bartash published an interesting article for MarketWatch. “Like a stiff tent pole, consumers are keeping the U.S. economy propped up. And it looks like they’ll have to do so for at least the next year. Strong consumer spending has given the economy a backbone to withstand spine-tingling political fights at home and abroad. Households boosted spending by 4.6% in the spring, and nearly 3% in the summer, to offset back-to-back drops in business investment and whispered talk of recession.” That statement is correct, and considering the consumer makes up roughly 70% of economic growth, this is why you “never count the consumer out.” The most valuable thing about the consumer is they are “financially stupid.” But what would expect from a generation whose personal motto is “YOLO – You Only Live Once.” This is why companies spend billions on social media, personal influencer's, television, radio, and internet advertising. If there is an outlet where someone will watch, listen, or read, you will find ads on it. Why? Because consumers have been psychologically bred to “shop till they drop.” As long as individuals have a paycheck, they will spend it. Give them a tax refund, they will spend it. Issue them a credit card, they will max it out.
Short Answer: The US consumer is 70% of GDP, they are the uniformed and they spend until their paycheck shrinks or their neighbor loses his job. This means there will be no recession until the consumer gets informed. History suggest that this may take anywhere between 6 to 18 months.
Ray Dalio has confirmed the above thinking by stating we are in the 7th innings of the credit cycle and the next 2 years may see the ending of this debt cycle. He refers to a 1937 correction as most likely. A good summary of his recent views below.
Question: It does not matter how the cycle ends, the FED can print over any crisis or does it?
This is general thinking. But what happens when the bail out is in the trillions and not the billions. The FED will not want to encourage MMT logic, as this approach could destroy the US dollar and the US economy. #
To conclude ...
In short, the next 6 to 18 months will be very interesting, equities should continue higher until the consumer cracks, and if you have enjoyed 10 years of profits it may be time to sell into the 2019-2021 very late debt cycle rally. Or more to the point watch the big boys to see if they are.
Of course everything is subject to an event blowing strong bearish winds from left field.
Fundamentals are important, and so is market timing, here at readtheticker.com we believe a combination of Gann Angles, Cycles, Wyckoff and Ney logic is the best way to secure better timing than most, after all these methods have been used successfully for 70+ years. To help you applying Richard Wyckoff and Richard Ney logic a wealth of knowledge is available via our RTT Plus membership. NOTE: readtheticker.com does allow users to load objects and text on charts, however some annotations are by a free third party image tool named Paint.net Investing
NOTE: readtheticker.com does allow users to load objects and text on charts, however some annotations are by a free third party image tool named Paint.net
Readtheticker
My website: www.readtheticker.com
We are financial market enthusiast using methods expressed by the Gann, Hurst and Wyckoff with a few of our own proprietary tools. Readtheticker.com provides online stock and index charts with commentary. We are not brokers, bankers, financial planners, hedge fund traders or investment advisors, we are private investors
© 2019 Copyright readtheticker - All Rights Reserved
Disclaimer: The material is presented for educational purposes only and may contain errors or omissions and are subject to change without notice. Readtheticker.com (or 'RTT') members and or associates are NOT responsible for any actions you may take on any comments, advice,annotations or advertisement presented in this content. This material is not presented to be a recommendation to buy or sell any financial instrument (including but not limited to stocks, forex, options, bonds or futures, on any exchange in the world) or as 'investment advice'. Readtheticker.com members may have a position in any company or security mentioned herein.
© 2005-2022 http://www.MarketOracle.co.uk - The Market Oracle is a FREE Daily Financial Markets Analysis & Forecasting online publication.