


The Coca-Cola Company (NYSE: KO) Looking to Remain Supported
Companies / Company Chart Analysis Nov 17, 2019 - 02:44 PM GMT

The Coca-Cola Company (NYSE: KO) is an American multinational corporation and it’s the world’s leading soft-drink company.
Since February 2019, KO rallied higher within an impulsive 5 waves advance breaking to new all time highs and opening further extension. Down from $56 peak, the stock started a correction lower which is currently unfolding as Double Three Structure which reached the equal legs area $52 – $50 from where buyers are expected to show up to resume the rally within the main bullish trend or provide a 3 waves bounce at least.
KO Daily Chart 11.3.2019
KO Daily Chart
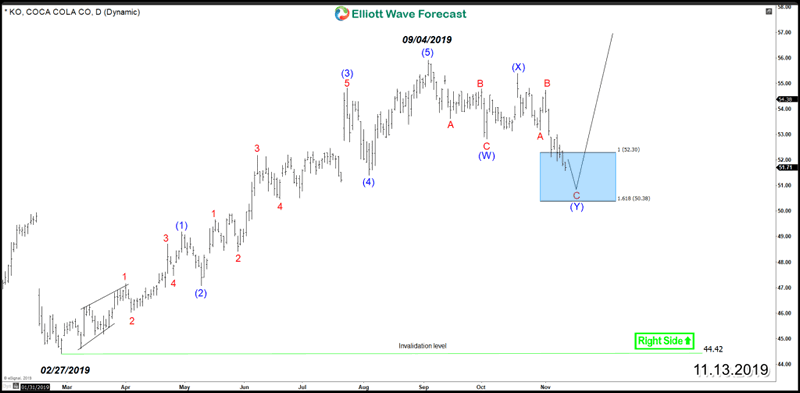
The above blue box is a High-frequency area where the stock is likely to end the cycle because it’s a zone used as a hedging area where buyers and sellers agrees on a technical reaction to take place from there allowing the stock to turn . Therefore, as long as the trend remains intact and more importantly $44 low is holding then KO will find support and bounce to the upside.
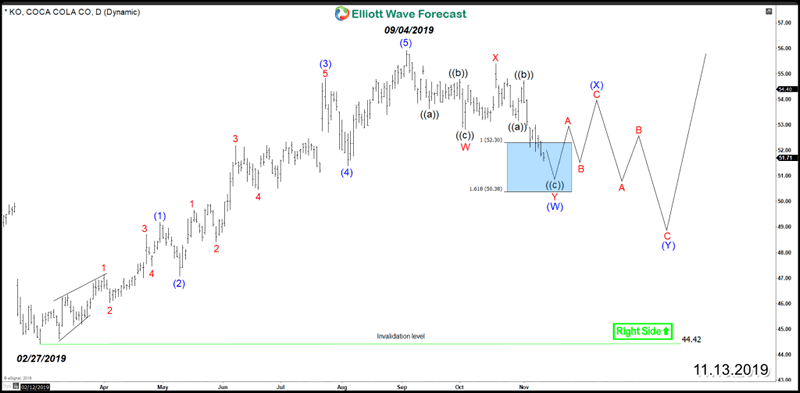
If the expected bounce fail to break to new highs, the stock can still do a 7 swings correction from September peak and find another extreme area later on at lower level before buyers would step in again for another chance to buy it.
KO Daily Chart Double Correction
KO Daily Chart Double Correction
In Conclusion, KO bullish cycle should remain intact as long as February low is holding and buyers are looking to remain in control because the stock is doing a corrective decline which is expected to presenting buying opportunities before resuming the move to the upside.
Explore a variety of investing ideas by trying out our services 14 days and learning how to trade our blue boxes using the 3, 7 or 11 swings sequence. You will get access to our 78 instruments updated in 4 different time frames, Live Trading & Analysis Session done by our Expert Analysts every day, 24-hour chat room support and much more.
By Ayoub Ben Rejeb
https://elliottwave-forecast.com
ElliottWave-Forecast has built its reputation on accurate technical analysis and a winning attitude. By successfully incorporating the Elliott Wave Theory with Market Correlation, Cycles, Proprietary Pivot System, we provide precise forecasts with up-to-date analysis for 52 instruments including Forex majors & crosses, Commodities and a number of Equity Indices from around the World. Our clients also have immediate access to our proprietary Actionable Trade Setups, Market Overview, 1 Hour, 4 Hour, Daily & Weekly Wave Counts. Weekend Webinar, Live Screen Sharing Sessions, Daily Technical Videos, Elliott Wave Setup .
Copyright © 2019 ElliottWave-Forecast - All Rights Reserved Disclaimer: The above is a matter of opinion provided for general information purposes only and is not intended as investment advice. Information and analysis above are derived from sources and utilising methods believed to be reliable, but we cannot accept responsibility for any losses you may incur as a result of this analysis. Individuals should consult with their personal financial advisors.
© 2005-2022 http://www.MarketOracle.co.uk - The Market Oracle is a FREE Daily Financial Markets Analysis & Forecasting online publication.