


What happens To The Global Economy If Oil Collapses Below $40 – Part II
Commodities / Crude Oil Nov 15, 2019 - 03:18 PM GMTBy: Chris_Vermeulen

In the first part of this research article, we shared our ADL predictive modeling research from July 10th, 2019 where we suggested that Oil prices would begin to collapse to levels near, or below, $40 throughout November and December of 2019. Our ADL modeling system suggests that oil prices may continue lower well into early 2020 where the price is expected to target $25 to $30 in February~April 2020.
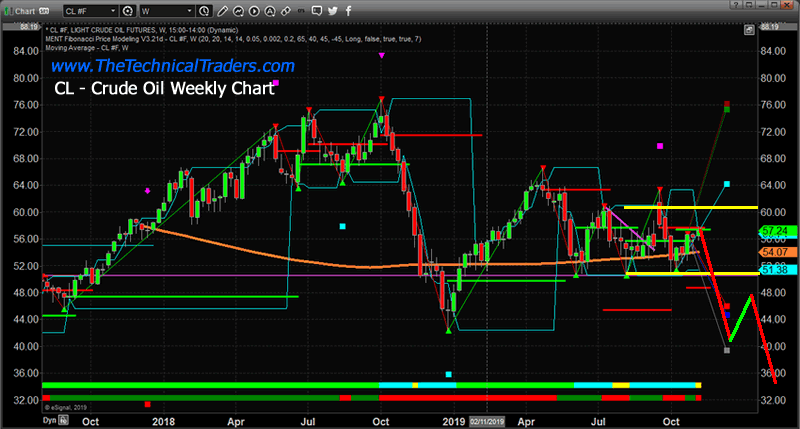
We believe this type of global commodity price collapse, essentially collapse in oil revenues for many global nations could present a very real crisis in our future. Most of the oil-producing nations rely on stable oil prices to supply much-needed revenues/income to support current and future operations and essential services. If oil prices collapse to levels below $40, this decrease would represent a -40%, or more, collapse in oil revenues for these nations. If oil prices fall to levels below $30, this would represent a -55%, or more, decrease in expected revenues.
You can get my daily market analysis articles and trade ideas by opting into my free market trend signals newsletter.
We believe the ADL predictive modeling systems results, if accurate, represents a very real potential that the global capital markets and stock market may experience a major crisis event before the end of 2020. This type of commodity collapse happened once before in history – nearly 10 years before the 1929 US stock market collapse and the slide in commodity prices continued in 1930 and beyond as an extended economic contraction pushed the US into an economic depression.
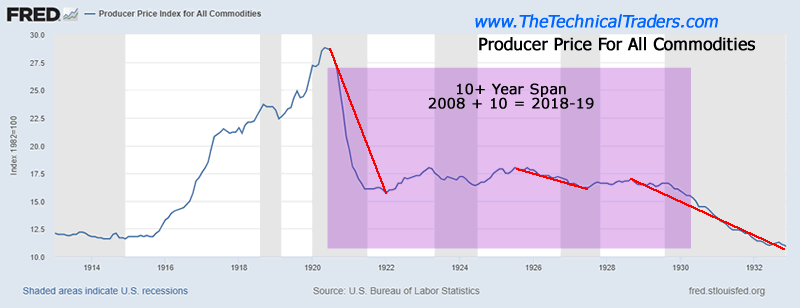
Producer Price Index for All Commodities from 1914 to 1933
Take a look at these charts for comparison. The first is a chart of the Producer Price Index for All Commodities from 1914 to 1933. Pay close attention to how commodity prices collapsed in 1921, approximately 9 to 10 years before the US stock market peak (1929) and commodities continue to slide lower. This collapse in commodity prices relates to the consumer, agriculture, and industrial demand after WWI and setup a shift within the capital markets more focused on stock market speculation. The period between 1923 and 1929 resulted in a complete shift in the capital markets where farms, agriculture, and manufacturing levels decreased while urban areas, cities, and the stock market flourished – until it ended in 1929. (Source: https://eh.net/encyclopedia)
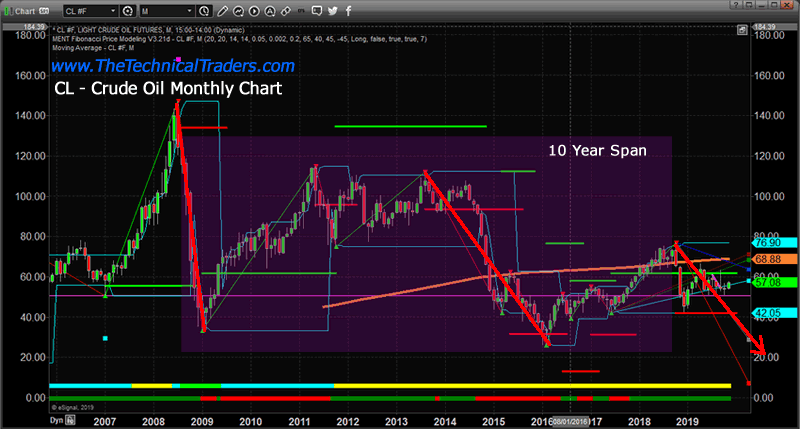
Monthly Crude Oil chart
Now, take a look at this Monthly Crude Oil chart which highlights very similar types of price patterns over the span of about 10 years. This strangely similar chart, in combination with the strangely similar set of circumstances related to farm, agriculture, and manufacturing as well as the shift of capital towards speculation in the US/Global stock market may be setting up another type of 1929 stock market peak event.
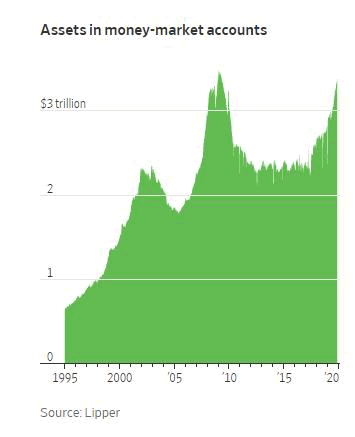
Assets in Money Market Accounts
The shift in the capital markets is very clearly seen in the following chart – the Assets in Money Market Accounts chart. One can clearly see that after the credit crisis in 2008-09, investors were not willing to participate in the Money Markets at levels prior to 2008. In fact, for the entire period of 2009 through 2017, global investors stayed away from Money Markets and only recently began pouring capital back into the markets near late 2017 – when confidence increased.
Yet, this chart also shows a very clear “shift” in capital engagement which is very similar to what happened in the late 1920s. At a time when manufacturing, agriculture and farm foreclosures were haunting the markets, investors poured capital in the stock market and speculative investments because these instruments were ripe with opportunity. The rally in the US stock market in the late 1920s became an opportunity that no one could resist. Is the same thing happening right now in the US stock market? Has a capital shift taken place that has global investors bumbling their way into the US stock market while trying to avoid/ignore obvious risks in local markets, manufacturing, and the global economy?
We believe the evidence is very clear for any investor willing to pull off the “bubble goggles” and take a good hard look at where we really are in the economic cycle. Unless something dramatic changes in relation to global economic growth, credit market expectations and consumer economic participation, it seems obvious that we are inching our way towards a global stock market peak just like we did in 1929.
Even if a trade deal between the US and China were to happen today and eliminate all trade tariffs, would this change anything or would this simply pour fuel onto the “capital shift” fire that is already taking place with speculation reaching frothy levels?
Skilled technical traders should pay very close attention to Oil Prices and global economic factors while this “zombie-land melt-up” continues. We believe this is not a healthy rally in the US stock market currently and is more similar to what happened in the last 1920s than anything we’ve seen over the past 80+ years.
In Part III of this research article, we’ll highlight some of the recent economic news that helps to further identify the complexity that makes up the current global stock market “zombie-land”.
If you want to earn 34%-50% a year return on your trading account with very few ETF trades then join me at the Wealth Building Newsletter today!
Chris Vermeulen
www.TheTechnicalTraders.com
Chris Vermeulen has been involved in the markets since 1997 and is the founder of Technical Traders Ltd. He is an internationally recognized technical analyst, trader, and is the author of the book: 7 Steps to Win With Logic
Through years of research, trading and helping individual traders around the world. He learned that many traders have great trading ideas, but they lack one thing, they struggle to execute trades in a systematic way for consistent results. Chris helps educate traders with a three-hour video course that can change your trading results for the better.
His mission is to help his clients boost their trading performance while reducing market exposure and portfolio volatility.
He is a regular speaker on HoweStreet.com, and the FinancialSurvivorNetwork radio shows. Chris was also featured on the cover of AmalgaTrader Magazine, and contributes articles to several leading financial hubs like MarketOracle.co.uk
Disclaimer: Nothing in this report should be construed as a solicitation to buy or sell any securities mentioned. Technical Traders Ltd., its owners and the author of this report are not registered broker-dealers or financial advisors. Before investing in any securities, you should consult with your financial advisor and a registered broker-dealer. Never make an investment based solely on what you read in an online or printed report, including this report, especially if the investment involves a small, thinly-traded company that isn’t well known. Technical Traders Ltd. and the author of this report has been paid by Cardiff Energy Corp. In addition, the author owns shares of Cardiff Energy Corp. and would also benefit from volume and price appreciation of its stock. The information provided here within should not be construed as a financial analysis but rather as an advertisement. The author’s views and opinions regarding the companies featured in reports are his own views and are based on information that he has researched independently and has received, which the author assumes to be reliable. Technical Traders Ltd. and the author of this report do not guarantee the accuracy, completeness, or usefulness of any content of this report, nor its fitness for any particular purpose. Lastly, the author does not guarantee that any of the companies mentioned in the reports will perform as expected, and any comparisons made to other companies may not be valid or come into effect.
Chris Vermeulen Archive |
© 2005-2022 http://www.MarketOracle.co.uk - The Market Oracle is a FREE Daily Financial Markets Analysis & Forecasting online publication.