


US Stock Markets “Roll Over” On Earnings and Economic Data At Channel Highs
Stock-Markets / Stock Markets 2019 Oct 23, 2019 - 04:20 PM GMTBy: Chris_Vermeulen

 As we near the end of October 2019, a very interesting price setup is taking place across many of the US market sectors recently. We only have a total of about seven trading days left in October 2019 and the Financial Sector ETF is rolling over with what appears to be an Engulfing Bearish price pattern near price channel highs. Additionally, the tech-heavy NASDAQ (NQ) has been mostly weaker compared to the ES and YM.
On September 30, 2019, we published this research post that highlighted why our predictive modeling systems suggested the S&P 500 and NASDAQ market sectors would become much more volatile than the Dow Jones Industrials: MODELING SUGGESTS BROAD MARKET ROTATION IN THE NQ & ES.
We believe this research is still very valid given the current price rotation near these price channel highs and given the potential that the Dow Jones stocks may become relatively stronger alternatives than the S&P 500 and NASDAQ sector stocks.
We believe a downside price rotation is setting up in the US and global stock markets and we believe the potential for large price moves exists in at-risk sectors like the Financials, Technology, Biotech, Energy, Services and other sectors that do not directly relate to what we feel are “essential consumer staples”. The Dow Jones Industrials Index is full of companies that traditionally perform better in a consumer-based economic contraction for investors – which is why we believe the YM will present a very unique opportunity going forward for skilled traders.
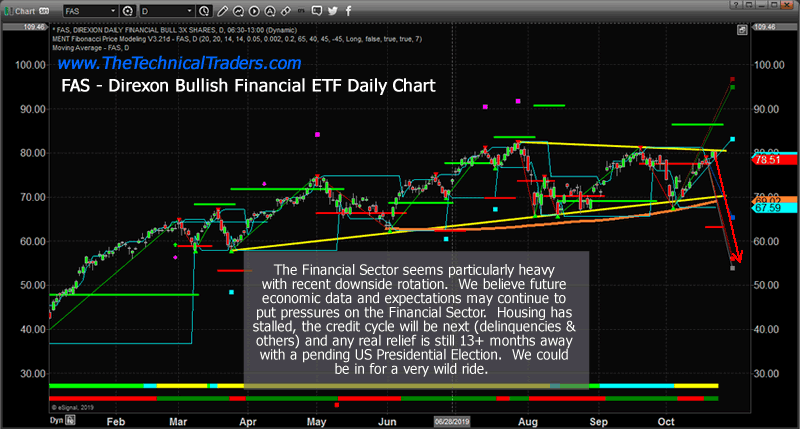
FAS Daily Chart, the Direxion Financial Bull ETF
This first FAS Daily Chart, the Direxion Financial BULL ETF highlights the price channel in YELLOW and highlights the recent price rotation near the $80 price level which constitutes a potential “new lower high” price rotation. Our longer-term cycle analysis tools predict a downside price move initiating over the next 7 to 10 trading days. We believe this new downside price trend could push price levels below the lower price channel level if this move is associated with external news or economic data that panics the markets.
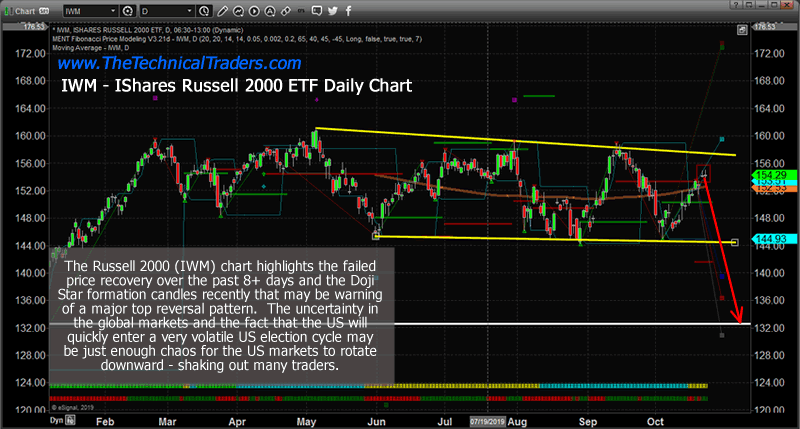
IWM, Russell 2000 ETF, Daily Chart
This IWM, Russell 2000 ETF, Daily chart highlights an “island Doji top” formation that is setting up as a very unique price formation. When Doji type candles form with a gap above the previous bars, this is often considered an “island top” type of formation. Doji candles represent indecision and uncertainty. They are often found near-critical top and bottom formation. In this current formation, we believe the island top formation is a very clear warning that a major price top is setting up in the Mid-Caps which would also be considered a “new failed price high” formation. Ultimately, the $144.50 level becomes critical support if price falls.
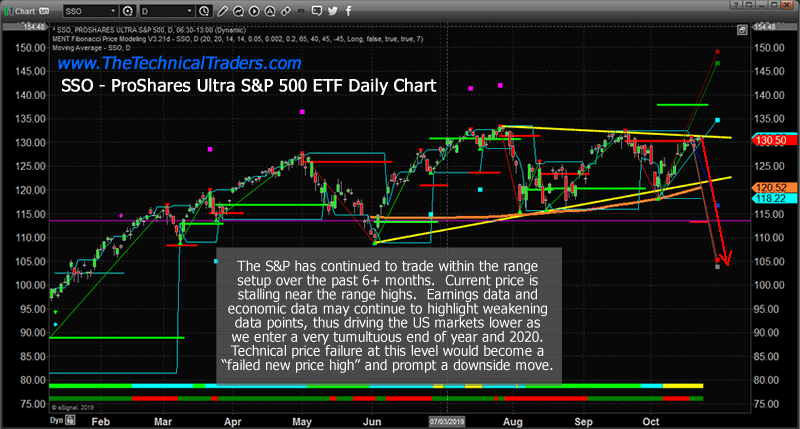
SSO, ProShares Ultra S&P 500 ETF, Daily Chart
This SSO, ProShares Ultra S&P 500 ETF, Daily chart highlights a similar price range setup. Notice how all of these sectors have rotated into these ranges over the past few months – very similar to what happened in 2015/16 prior to the 2016 elections. We believe the uncertainty related to global trade, global economics and the US political “circus” will continue to put pricing pressure on the US stock market and global markets. We believe the inability to achieve “new price highs” throughout many sectors is a very clear warning that a larger downside price move, a type of price reversion, maybe setting up and we have been trying to warn our followers to be very cautious in taking unnecessary risks at this time while trading.
If our cycle research and predictive modeling systems are correct, we could be setting up for a downside price move that may act as a “true price exploration/reversion event” and potentially target levels that may be below the June 2019 lows. If this move is associated with some external news event or global crisis event, we may see prices fall to levels below the December 2018 low price levels.
Overall, we urge all skilled technical traders to stay very cautious over the next few months. Target solid trades that present very clear opportunities and properly position your trades to attempt to mitigate unknown risks. This is not the time to go “all-in” on anything as the markets are far more capable of being irrational than you are likely to be able to handle the risks that are associated with a crazy market move.
As a technical analysis and trader since 1997, I have been through a few bull/bear market cycles. I believe I have a good pulse on the market and timing key turning points for both short-term swing trading and long-term investment capital. The opportunities are massive/life-changing if handled properly.
As a technical analysis and trader since 1997, I have been through a few bull/bear market cycles. I believe I have a good pulse on the market and timing key turning points for both short-term swing trading and long-term investment capital. The opportunities are massive/life-changing if handled properly.
I urge you visit my ETF Wealth Building Newsletter and if you like what I offer, join me with the 1-year subscription to lock in the lowest rate possible and ride my coattails as I navigate these financial market and build wealth while others lose nearly everything they own during the next financial crisis. Join Today to Get a Free 1oz Silver Bar with a subscription – Offer Ends This Week!
Chris Vermeulen
www.TheTechnicalTraders.com
Chris Vermeulen has been involved in the markets since 1997 and is the founder of Technical Traders Ltd. He is an internationally recognized technical analyst, trader, and is the author of the book: 7 Steps to Win With Logic
Through years of research, trading and helping individual traders around the world. He learned that many traders have great trading ideas, but they lack one thing, they struggle to execute trades in a systematic way for consistent results. Chris helps educate traders with a three-hour video course that can change your trading results for the better.
His mission is to help his clients boost their trading performance while reducing market exposure and portfolio volatility.
He is a regular speaker on HoweStreet.com, and the FinancialSurvivorNetwork radio shows. Chris was also featured on the cover of AmalgaTrader Magazine, and contributes articles to several leading financial hubs like MarketOracle.co.uk
Disclaimer: Nothing in this report should be construed as a solicitation to buy or sell any securities mentioned. Technical Traders Ltd., its owners and the author of this report are not registered broker-dealers or financial advisors. Before investing in any securities, you should consult with your financial advisor and a registered broker-dealer. Never make an investment based solely on what you read in an online or printed report, including this report, especially if the investment involves a small, thinly-traded company that isn’t well known. Technical Traders Ltd. and the author of this report has been paid by Cardiff Energy Corp. In addition, the author owns shares of Cardiff Energy Corp. and would also benefit from volume and price appreciation of its stock. The information provided here within should not be construed as a financial analysis but rather as an advertisement. The author’s views and opinions regarding the companies featured in reports are his own views and are based on information that he has researched independently and has received, which the author assumes to be reliable. Technical Traders Ltd. and the author of this report do not guarantee the accuracy, completeness, or usefulness of any content of this report, nor its fitness for any particular purpose. Lastly, the author does not guarantee that any of the companies mentioned in the reports will perform as expected, and any comparisons made to other companies may not be valid or come into effect.
Chris Vermeulen Archive |
© 2005-2022 http://www.MarketOracle.co.uk - The Market Oracle is a FREE Daily Financial Markets Analysis & Forecasting online publication.