


Stock Market Indexes Struggle and TRAN suggests a possible top
Stock-Markets / Stock Markets 2019 Oct 22, 2019 - 05:46 PM GMTBy: Chris_Vermeulen

 Nearing the end of October, traders are usually a bit more cautious about the markets than at other times of the year. History has proven that October can be a month full of surprises. It appears in 2019 is no different. Right now, the markets are still range bound and appear to be waiting for some news or other information to push the markets outside of the defined range.
We still have at least one more trading week to go in October, yet the US markets just don’t want to move away from this 25,000 to 27,000 range for the Dow Industrials. In fact, since early 2019, we have traded within a fairly moderate price range of about 3200 points on the YM – a rotational range of about 11% in total size. Historically, this is a rather large sideways trading range for the YM – nearly 3x the normal volatility prior to 2015.
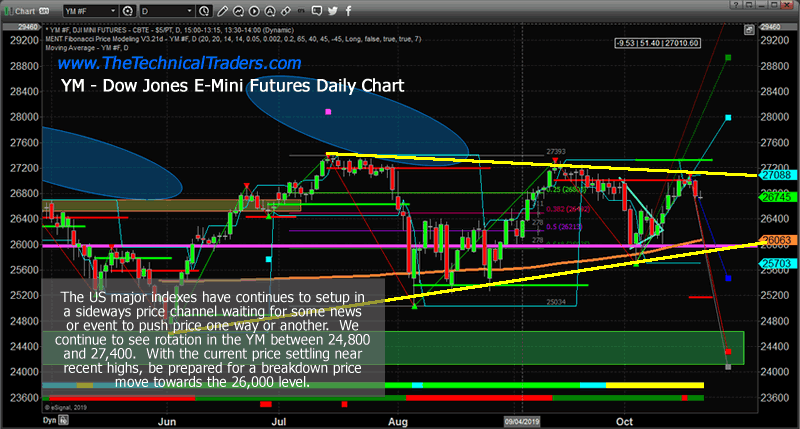
Daily YM Chart
This Daily YM chart highlights the trading range that has setup over the past 5+ months with the YELLOW LEVELS. Price continues to tighten into a more narrow range as we progress towards the end of 2019. Our researchers believe a moderate price breakdown will occur near the apex of this move which will act as a “price reversion event” and allow the markets to rally into 2020 and beyond. We are using our proprietary price modeling tools to attempt to identify any signs that can help us validate this research. Until we have some type of validation of the move, we can only wait as the risks associated with taking trades at this time are much higher than normal.
The SP500 cycle analysis I did last week provides some solid forward-looking direction as well.
TRAN – Transportation Index
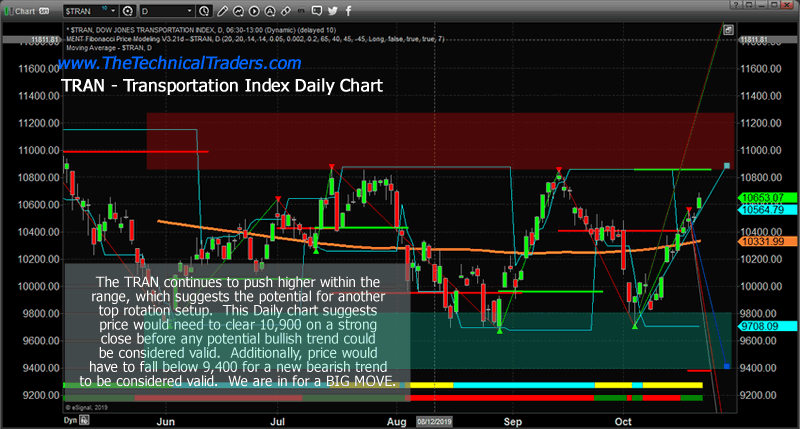
The TRAN (Transportation Index) is also confirming our analysis of a sideways price range with very little opportunity at the moment for a high-risk trade. The TRAN gapped higher on October 21 which may set up a massive top pattern formation, possibly a Three River Evening Star pattern of a massive Engulfing Bearish pattern. We’ve highlighted the resistance range in RED on this chart and the support range in GREEN. Caution is the name of the game right now. Let the markets tell us what is going to happen next.
The weekly chart of the TRAN
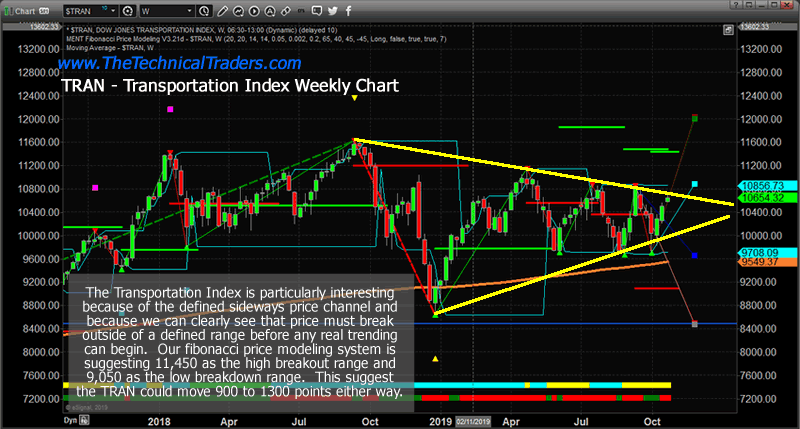
This Weekly chart of the TRAN shows a clearer picture of the sideways price range that is setting up and how close we are to the APEX of the Flag/Pennant formation. Again, we know the markets are going to break clear of this Flag/Pennant formation, but the direction of the breakout will likely depend on future news events that we can’t predict. Any global failure or crisis may push the markets lower. Any global victory or success may push the markets higher. Right now, we believe the risk factors are very high and we are suggesting that traders need to be extremely cautious throughout the end of the year.
Concluding Thoughts:
There are still massive opportunities in sector ETFs and commodity ETFs for traders that want to find quick/short-term trades. Gold and Silver are setting up major momentum bottoms. Natural Gas continues to set up a massive momentum bottom and Technology continues to set up a major topping type of pattern. The shift in capital away from risk will surely drive some really big trends over the next few weeks and months. A clear picture of what to expect looking forward up to 45 days I still rely on my market trend charts to know when I should be buying or selling positions. Skilled technical traders will be able to find incredible opportunities if they are patient and don’t “blow up” their accounts chasing risky rotation.
As a technical analysis and trader since 1997, I have been through a few bull/bear market cycles. I believe I have a good pulse on the market and timing key turning points for both short-term swing trading and long-term investment capital. The opportunities are massive/life-changing if handled properly.
I urge you visit my ETF Wealth Building Newsletter and if you like what I offer, join me with the 1-year subscription to lock in the lowest rate possible and ride my coattails as I navigate these financial market and build wealth while others lose nearly everything they own during the next financial crisis. Join Today to Get a Free 1oz Silver Bar with a subscription – Offer Ends This Week!
Chris Vermeulen
www.TheTechnicalTraders.com
Chris Vermeulen has been involved in the markets since 1997 and is the founder of Technical Traders Ltd. He is an internationally recognized technical analyst, trader, and is the author of the book: 7 Steps to Win With Logic
Through years of research, trading and helping individual traders around the world. He learned that many traders have great trading ideas, but they lack one thing, they struggle to execute trades in a systematic way for consistent results. Chris helps educate traders with a three-hour video course that can change your trading results for the better.
His mission is to help his clients boost their trading performance while reducing market exposure and portfolio volatility.
He is a regular speaker on HoweStreet.com, and the FinancialSurvivorNetwork radio shows. Chris was also featured on the cover of AmalgaTrader Magazine, and contributes articles to several leading financial hubs like MarketOracle.co.uk
Disclaimer: Nothing in this report should be construed as a solicitation to buy or sell any securities mentioned. Technical Traders Ltd., its owners and the author of this report are not registered broker-dealers or financial advisors. Before investing in any securities, you should consult with your financial advisor and a registered broker-dealer. Never make an investment based solely on what you read in an online or printed report, including this report, especially if the investment involves a small, thinly-traded company that isn’t well known. Technical Traders Ltd. and the author of this report has been paid by Cardiff Energy Corp. In addition, the author owns shares of Cardiff Energy Corp. and would also benefit from volume and price appreciation of its stock. The information provided here within should not be construed as a financial analysis but rather as an advertisement. The author’s views and opinions regarding the companies featured in reports are his own views and are based on information that he has researched independently and has received, which the author assumes to be reliable. Technical Traders Ltd. and the author of this report do not guarantee the accuracy, completeness, or usefulness of any content of this report, nor its fitness for any particular purpose. Lastly, the author does not guarantee that any of the companies mentioned in the reports will perform as expected, and any comparisons made to other companies may not be valid or come into effect.
Chris Vermeulen Archive |
© 2005-2022 http://www.MarketOracle.co.uk - The Market Oracle is a FREE Daily Financial Markets Analysis & Forecasting online publication.