


Dow Stock Market Trend Forecast Update
Stock-Markets / Stock Markets 2019 Sep 21, 2019 - 10:00 AM GMTBy: Nadeem_Walayat

This is the 2nd of my 2 part latest update to my stock market trend forecast for 2019 (Part1). Also note that the whole of this analysis was first made available to Patrons who support my work Stock Market Trend Forecasts When Mega-Trends Collide).
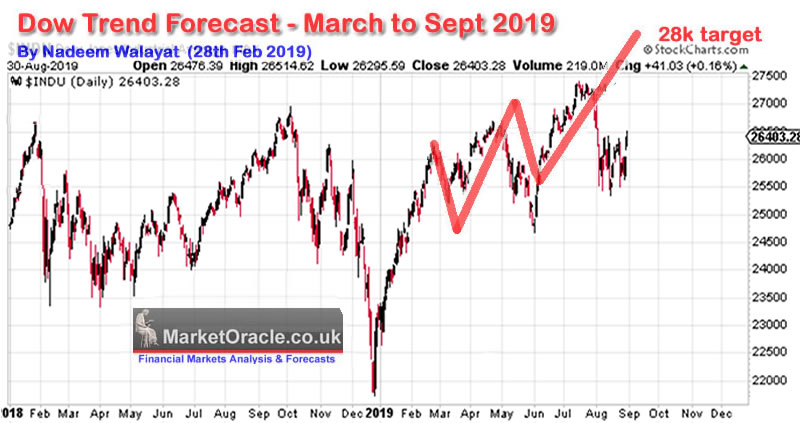
Clearly August has seen a significant deviation from the trend, trading down 25,300 which is significantly lower than the 26,500 I thought would hold any decline into August. The Dow currently stands at -4.5% against the forecast trend. This analysis will update on whether its possible for the Dow to converge to the trend forecast (red line) towards a late September high of Dow 28k which with 3 weeks to go is definitely a tough ask.
Technical Analysis
Trend Analysis
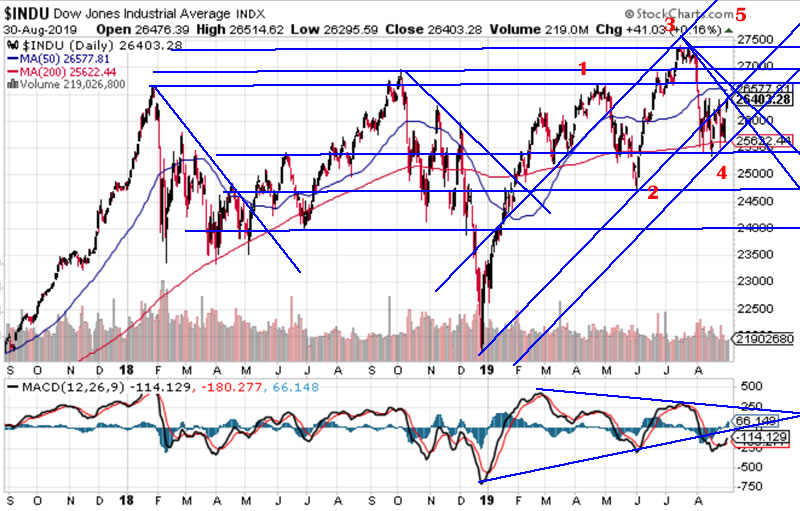
- The Dow continues put in a series of higher lows and highs, however the pace of advance has slowed with the most recent correction about 1000 points deeper than it should have been which suggests that the market is gearing up for a stronger down move later in the year (October).
- Support is at 25,500, 24,750, 24,000. Which suggests a failure for the trend to resume could likely see the Dow trade below 24,000.
- Resistance is at 26,400, 26,750, 27000 and the last high of 27,360.
- Trendline support is at 25,700, rising to 26,600 by the end of September. So the Dow has some room to correct down to 26,200 if it chose to without altering an overall bullish picture.
Elliott Wave
My last analysis Elliott wave proved accurate so remains unchanged, i.e. we have had a Wave 4 correction which should set us up for a fifth wave advance to a new all time high by late Sept / Early October.
MACD - Gave a bearish signal when it broke below the up trendline, suggests that the stock market is weakening, though marginally oversold in immediate terms. Which suggests the Dow should trade higher during September but fail to reach its all time high.
SEASONAL ANALYSIS
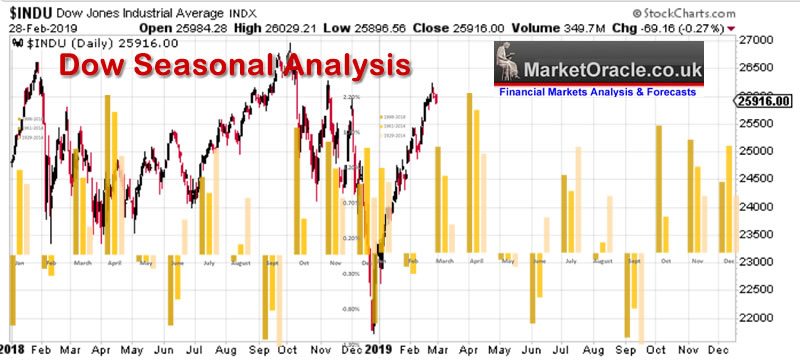
August was supposed to be a positive month whilst September is expected to be a weak month. However we clearly have some sort of inversion going on here, which suggests that as August was weak than September should be stronger than seasonal expectations.
Therefore in seasonal terms my 'adjusted' expectations are for a strong September, Weak October, Strong November and December. As for how strong and weak, I'll determine in my next analysis due late September.
US Interest Rates
As expected the US cut interest rates by 0.25%. which is confirmation that the Fed will do whatever is necessary to avoid a recession in 2020. Which translates into blowing asset prices bubbles, that should be bullish for US housing and stocks.
Conclusion
Inverted yield curve, recession warnings, trade wars, climate change, all that and the Dow's only down 4% from it's all time high?
The Dow peaked at 27,359, last close at 26,403. So the Dow is LESS than 4% from it's ALL TIME HIGH! A fact that the perma fear peddling mainstream press and most commentators don't or can't seem to grasp, especially the perma bear variety who see a bear market in EVERY correction. Okay, yes we have had a correction, and it was a couple of % and couple of weeks longer than I thought it would be, but 4% is NOTHING! In fact if the market was to give me an unexpected correction, then I would have preferred something more like 8%, at least then I could do something with it i.e. buy more AI stocks at a discount, 4% is nothing! Folks, not worth worrying about.
So what's likely to happen next ?
This analysis suggests the Dow should have another run higher at it's all time high during September, i.e. target a break of 27,360 before it can reach 28,000 by perhaps early October. However, more probable now is that the Dow is unable to break above 27,360 and turns lower for October with a double top pattern of sorts.
So in conclusion, in terms of the bull market, nothing much has changed, were still trending towards 28,000, even if we fails to get there this time i.e. by the end of September ahead of a weak October. Likewise expectations for later in the year remain largely intact i.e. a santa rally towards Dow 30k. The prospects for which I will seek to update towards the end of September.
Peering into the Mists of Time
Don't forget we are in a bull market and what bull markets do is to trade at new all time highs. The Dow last traded AT a new all time high on 16th July. As long as the Dow continues to follow this pattern of corrections followed by trends to new all time highs then there is nothing to worry about. Sure we will get wild rides at times of as much as 20%! But 4% is literally nothing! Until that pattern for new highs fails just buy the target stocks when the opportunity presents itself and let the perma crowd worry about bear markets always being just around the corner as this stocks bull market driven by multiple mega-trends continues to climb ever higher, 2019. 2020, 2021....
The whole of this analysis was first made available to Patrons who support my work: Stock Market Trend Forecasts When Mega-Trends Collide.
So for immediate First Access to ALL of my analysis and trend forecasts then do consider becoming a Patron by supporting my work for just $3 per month. https://www.patreon.com/Nadeem_Walayat.
Scheduled Analysis
- UK Housing market series
- Stock Market Trend Forecast Sept to Dec
- Machine Intelligence Investing stocks sub sector analysis
- US Dollar Index
- NASDAQ
- EuroDollar Futures
- EUR/RUB
Recent Analysis includes:
- Bitcoin Price Analysis and Trend Forecast
- British Pound Trend Forecast vs "Dead in a Ditch" BrExit Civil War General Election Chaos
- Stock Market Trend Forecasts When Mega-Trends Collide
- How to Invest in AI Stocks with Buying Levels
- China SSEC Stock Market Fundamentals and Trend Analysis Forecast
- Silver Investing Trend Analysis and Price Forecasts 2019 Update
- Gold Price Breakout - Trend Forecast 2019 July Update
- Investing to Profit and Benefit from Human Life Extension AI Stocks and Technologies
Your analyst a consistent stock market bull since Dow 7000. (15 Mar 2009 - Stealth Bull Market Follows Stocks Bear Market Bottom at Dow 6,470).
And ensure you are subscribed to my ALWAYS FREE newsletter for my next in-depth analysis.
Nadeem Walayat
Copyright © 2005-2019 Marketoracle.co.uk (Market Oracle Ltd). All rights reserved.
Nadeem Walayat has over 30 years experience of trading derivatives, portfolio management and analysing the financial markets, including one of few who both anticipated and Beat the 1987 Crash. Nadeem's forward looking analysis focuses on UK inflation, economy, interest rates and housing market. He is the author of five ebook's in the The Inflation Mega-Trend and Stocks Stealth Bull Market series that can be downloaded for Free.


 Nadeem is the Editor of The Market Oracle, a FREE Daily Financial Markets Analysis & Forecasting online publication that presents in-depth analysis from over 1000 experienced analysts on a range of views of the probable direction of the financial markets, thus enabling our readers to arrive at an informed opinion on future market direction. http://www.marketoracle.co.uk
Disclaimer: The above is a matter of opinion provided for general information purposes only and is not intended as investment advice. Information and analysis above are derived from sources and utilising methods believed to be reliable, but we cannot accept responsibility for any trading losses you may incur as a result of this analysis. Individuals should consult with their personal financial advisors before engaging in any trading activities.
Nadeem Walayat Archive |
© 2005-2022 http://www.MarketOracle.co.uk - The Market Oracle is a FREE Daily Financial Markets Analysis & Forecasting online publication.