


Crude Oil Price Setting Up For A Downside Price Rotation
Commodities / Crude Oil Sep 13, 2019 - 02:55 PM GMTBy: Chris_Vermeulen

 Crude Oil has been trading in a fairly narrow range since mid-August – between $52 and $57 ppb. Our Adaptive Dynamic Learning (ADL) predictive modeling system suggested the downside price move in late July/early August was expected and the current support aligns very well with our ADL predictions of higher price rotation throughout most of September/October. Please take a minute to review the original research post below :
July 10, 2019: PREDICTIVE MODELING SUGGEST OIL HEADED MUCH LOWER
Crude Oil Monthly Chart Forecast
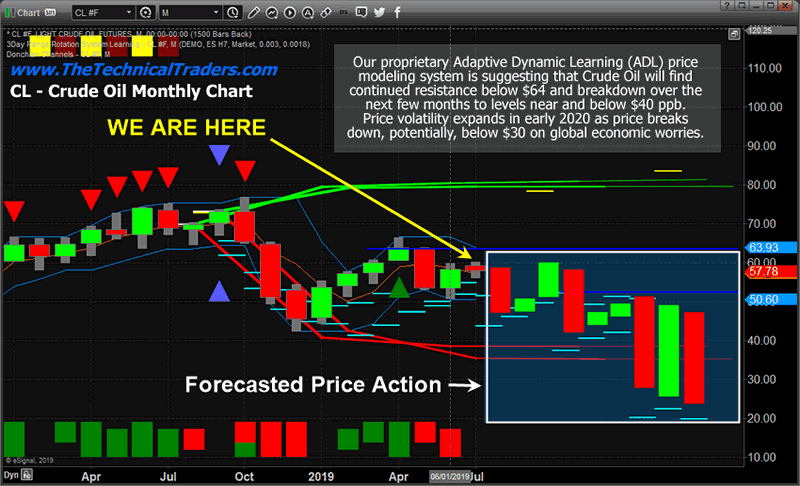
We believe the current price highs, near $59 to $60, will likely continue as strong price resistance over the next 25+ trading days before a bigger breakdown begins near Mid-October. We expect the price to continue rotating within a fairly narrow range in alignment with our ADL predictions. Our original article suggested a high price target area near $60 from our ADL research. Now that Crude Oil has nearly reached this level, we believe the continued upside opportunity in Crude Oil is limited. Be sure to opt-in to our Free Trade Ideas Newsletter to get more updates.
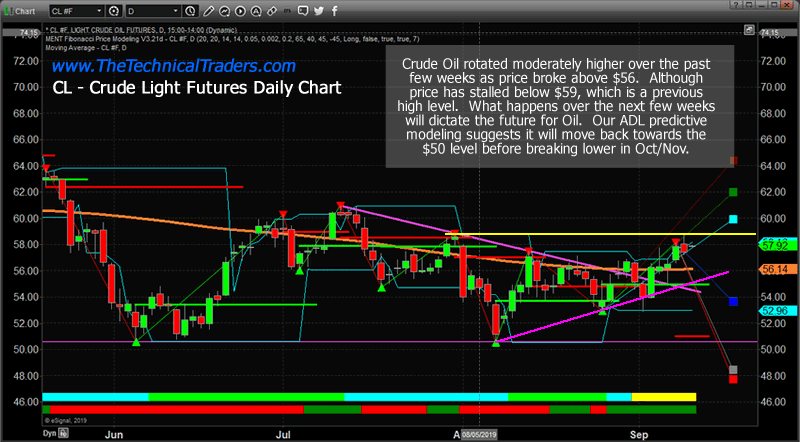
Daily Crude Oil Chart
This Daily Crude Oil Chart highlights what we believe will become resistance just below the $60 price level and suggests the $55 to $56 price level may be intermediate support. Thus, we expect the price to rotate a bit lower, possibly into the $54 to $56 level, then stall and rotate further as we transition into the end of September.
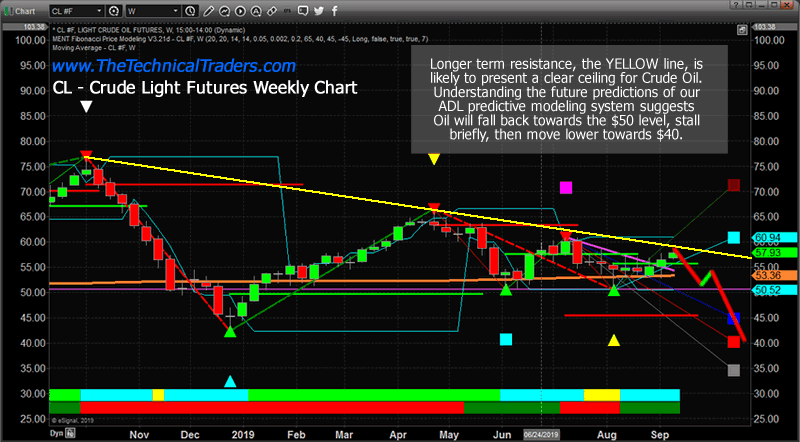
Weekly Crude Oil Chart Trend Direction
We don’t expect anything crazy to happen in Oil until later in September or into early October. Our ADL predictive modeling suggests that Crude Oil will peak in October and begin a broader downside move towards levels just below $50. Crude Oil may begin this move a bit earlier than our ADL system predicts because of news or some fundamental data related to oil demand/supply. It is not uncommon for the price to move towards the ADL predicted levels many weeks before or after our Monthly ADL predictions. When we create the Monthly ADL charts, the data represented is based on highly probable levels for the completed month. So, we know that near the month of October or November, Oil should be targeting the sub-$50 level.
Concluding Thoughts:
Ultimately, near the end of 2019 or into early 2020, Oil should be targeting the sub-$30 price level on a larger downside price move. Sub-$30 Oil would likely mean that global supply/demand issues, as well as global economic concerns, would be top-tier issues. We believe the future price moves in Crude Oil will present very clear opportunities for skilled technical traders. Right now, we have to be patient as the price continues to rotate above $55 and below $60 before the real price moves begin to take place.
I have had a series of great trades this month. In fact, over the past 20 months, my ETF trading newsletter portfolio has generated over 100% return when compounded for members. And we locking in 5.1% profits on Tuesday with the Russell 2000 index, and also XLU for a quick 1.43% profit as well. So, if you believe in technical analysis, then this is the newsletter and market condition for you to really shine, especially with my trading indicators coming online.
As a technical analysis and trader since 1997, I have been through a few bull/bear market cycles. I believe I have a good pulse on the market and timing key turning points for both short-term swing trading and long-term investment capital. The opportunities are massive/life-changing if handled properly.
Be prepared for these price swings before they happen and learn how you can identify and trade these fantastic trading opportunities in 2019, 2020, and beyond with our Wealth Building & Global Financial Reset Newsletter.
Join me with a subscription to lock in the lowest rate possible and ride my coattails as I navigate these financial market and build wealth while others lose nearly everything they own during the next financial crisis.
Chris Vermeulen
www.TheTechnicalTraders.com
Chris Vermeulen has been involved in the markets since 1997 and is the founder of Technical Traders Ltd. He is an internationally recognized technical analyst, trader, and is the author of the book: 7 Steps to Win With Logic
Through years of research, trading and helping individual traders around the world. He learned that many traders have great trading ideas, but they lack one thing, they struggle to execute trades in a systematic way for consistent results. Chris helps educate traders with a three-hour video course that can change your trading results for the better.
His mission is to help his clients boost their trading performance while reducing market exposure and portfolio volatility.
He is a regular speaker on HoweStreet.com, and the FinancialSurvivorNetwork radio shows. Chris was also featured on the cover of AmalgaTrader Magazine, and contributes articles to several leading financial hubs like MarketOracle.co.uk
Disclaimer: Nothing in this report should be construed as a solicitation to buy or sell any securities mentioned. Technical Traders Ltd., its owners and the author of this report are not registered broker-dealers or financial advisors. Before investing in any securities, you should consult with your financial advisor and a registered broker-dealer. Never make an investment based solely on what you read in an online or printed report, including this report, especially if the investment involves a small, thinly-traded company that isn’t well known. Technical Traders Ltd. and the author of this report has been paid by Cardiff Energy Corp. In addition, the author owns shares of Cardiff Energy Corp. and would also benefit from volume and price appreciation of its stock. The information provided here within should not be construed as a financial analysis but rather as an advertisement. The author’s views and opinions regarding the companies featured in reports are his own views and are based on information that he has researched independently and has received, which the author assumes to be reliable. Technical Traders Ltd. and the author of this report do not guarantee the accuracy, completeness, or usefulness of any content of this report, nor its fitness for any particular purpose. Lastly, the author does not guarantee that any of the companies mentioned in the reports will perform as expected, and any comparisons made to other companies may not be valid or come into effect.
Chris Vermeulen Archive |
© 2005-2022 http://www.MarketOracle.co.uk - The Market Oracle is a FREE Daily Financial Markets Analysis & Forecasting online publication.