


Stock Market Crash Black Swan Event Set Up Sept 12th?
Stock-Markets / Stock Market Crash Sep 12, 2019 - 01:42 PM GMTBy: Brad_Gudgeon

 The charts below are telling me we crash lower on 9/12 and again on 9/18-19ish.The expected 9/12 bottom should hold the SPX 2870 area. The 9/18 to 9/19 or the 20th move should go down below the 8/5 low to create an irregular bottom either on 9/19 or 9/20.
This is telling me that we likely go to new highs (double top?) around Oct 18, 2019 monthly Oct Option Expiry and then crash into early November to finish out the cycle 10 month low from Dec 24/26, 2018.
It is going to get interesting, because should an October 18th “Double Top” happens, we may see new highs by mid December, 2019 (e-wave read and 4 year cycle) and then go down harder into early 2020 around Feb/March to sync with the 4 year cycle from 2015-16. WOW!!
Benner's Cycle is telling me we see another top likely around late summer 2020 and a final crash into late 2020 with a possible double bottom in early 2021 like 2000 to 2002/03.
All this what's going on right now is that when the FED lower rates (lowering rates is bearish, not bullish for stocks) we have the set up for a quick crash. Recently we have seen asset allocation from growth to value and 9/12 may be part of that shift (selling the growth and buying value) into the FED day (9/18) and then selling again because of the rate cut, which is likely.
The charts below have the cycles and E-Wave analysis as to why this could easily happen.
Astro-wise, we are in period of extremes over the next week, with the Sun in Virgo opposing Neptune in Pisces on 9/10, and Mars in Virgo forming a negative aspect to Jupiter in Sagittarius early on 9/12, all in mutable signs.
That gives us a window for a low between 9/10 and 9/12. The solar cycle looks for a low between 9/11 and 9/13 pegging 9/12 for the low. Also, Mars opposes Neptune (with the Sun) on 9/14, placing the low mid way between 9/10 and 9/14, voila 9/12!
The cycles next week deviate from the norm by creating a half cycle Gann top (16+9 and 32+5 TD top on 9/18, the FED announcement day, which tends to create tops) near the expected Gann 32 TD low due on 9/19 only one day past the FED announcement!
This is related to the third passage of the Jupiter/Neptune square due on September 21. It is all about irrational exuberance and panic-like hysteria all wrapped up in just a 6 or 7 trading period into the Gann 32 TD low harmonic to the August 5 low due near 9/19.
Put on your seat belts folks, you are about to get the ride of your life! For those who know in advance, lots of money can be made in high volatile times, with big moves, both up and down!
Are you ready?
Into this weekend, I'm offering my Annual Subscription for $495 instead of the normal $600 starting tomorrow. Follow the link below.
Peace
BG
The first chart below shows the expected outcome over the next 2 weeks. My charts also explain what a “3 Gap Play” is. These kinds of set ups often occur near a “Black Swan Event”, something unexpected that shakes the market . A “3 Gap Play” is named on the chart and explain that when the Exhuastion Gap occurs to the upside, there is no choice but for the gaps to be filled and then some.
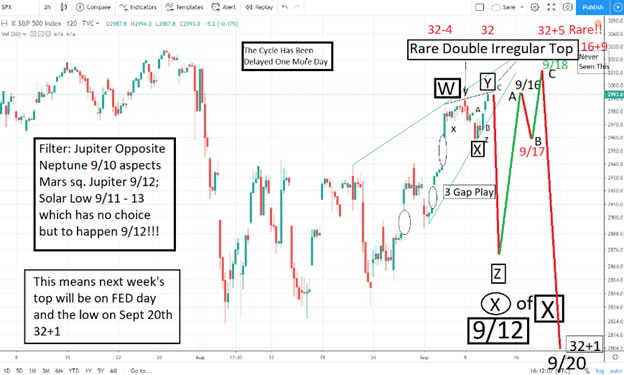
The set up tells me it will likely happen all in one single trading session into 9/12. I don’t know if the Gann 32 TD low due 9/19 will happen quickly from 9/18 to 9/19 or possibly into 9/20, which is near the final passage of the Jupiter/Neptune square on 9/21 (a Saturday).
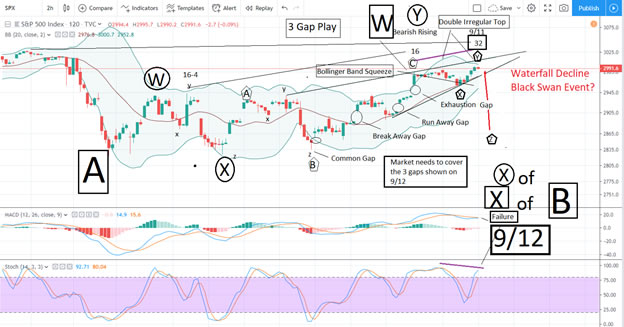
The second chart is a 2 hour chart that show the closing of the Bollinger Bands, which happen before a big move of magnitude, this time to the downside. It also shows an MACD 2 hourly “Kiss of Death” and NEG D (negative divergence) on the Stochastics.
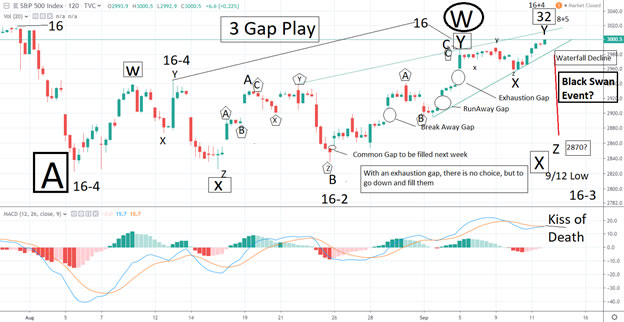
The third chart reiterates the Gann Cycles, the “3 Gap Play” and “Bearish Rising Wedge” with the waterfall decline to follow. The Common Gap at SPX 2848 should be filled next week.
The lower bottom expect around 9/19, should make thing interesting into around Oct 18, increasing the the magnitiude of the harmonic waves to the previous W top( Aug 5 to Sept 5 to October 18). The E-Wave formation then becomes a highly bearish (WXY, which is an inverted bearish flat as opposed to an XYZ formation which is bullish) B Wave, (A was 8/5) and voila we have the C Wave crash into early November!
Brad Gudgeon
Editor of The BluStar Market Timer
The BluStar Market Timer was rated #1 in the world by Timer Trac in 2014, competing with over 1600 market timers. This occurred despite what the author considered a very difficult year for him. Brad Gudgeon, editor and author of the BluStar Market Timer, is a market veteran of over 30 years. The website is www.blustarmarkettimer.info To view the details more clearly, you may visit our free chart look atwww.blustarmarkettimer.com
Copyright 2019, BluStar Market Timer. All rights reserved.
Disclaimer: The above information is not intended as investment advice. Market timers can and do make mistakes. The above analysis is believed to be reliable, but we cannot be responsible for losses should they occur as a result of using this information. This article is intended for educational purposes only. Past performance is never a guarantee of future performance.
Brad Gudgeon Archive |
© 2005-2022 http://www.MarketOracle.co.uk - The Market Oracle is a FREE Daily Financial Markets Analysis & Forecasting online publication.