


Can Crude Oil Price Stay Above $50 To Support Producers Expectations?
Commodities / Crude Oil Sep 06, 2019 - 05:27 PM GMTBy: Chris_Vermeulen

 Recent news suggests that oil producers are attempting to increase production levels after failing to attempt to push prices higher by cutting production levels. Globally, oil producers want to see oil prices rise above $65 ppb in an effort to support profit and production cost expectations. The real issue for the nation/states that rely on oil production/sales is that the global economy may not cooperate with their expectations over the next 24+ months. Before we get into the details, be sure to opt-in to my Free Market Forecast and Trade Ideas Newsletter so stay on top of these market moves.
On August 6th, 2019, we posted this article suggesting that Natural Gas and Crude Oil were setting up diverging trades.
August 6th, 2019: NATURAL GAS AND CRUDE OIL – DIVERGING SETUPS FOR TECHNICAL TRADERS
At that time, we wrote that we expected Crude oil to break lower from the $62 ppb level and target $55, then $49 based on our original Crude Oil research from May 21, 2019.
Additionally, on July 29, 2019, we authored and posted this article suggesting that Crude Oil would begin a downside move from $55 to levels near $50 :
All of this research was related to our Adaptive Dynamic Learning (ADL) research post from July 10, 2019: https://www.thetechnicaltraders.com/predictive-modeling-suggest-oil-headed-much-lower-by-early-2020/
This incredible predictive modeling research suggested that Oil would move dramatically lower towards the $50 level, then stall near $50 to $55+ through September and October. Ultimately breaking lower in late October/November to levels near or below $40.
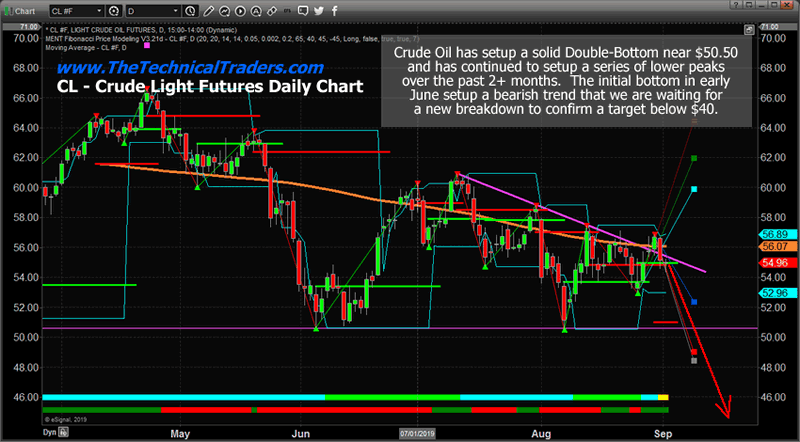
Crude Oil Daily Chart Analysis
Our researchers believe Crude Oil could become very volatile as price nears the apex of the Pennant/Flag formation that is setting up. This Daily chart highlights the attempted “scouting party” price rotation above the price resistance channel. The news over the past holiday weekend suggests the global economy may not see any real bump in activity over the next 12+ months and we believe this aligns with our longer-term research that Oil should target the sub $40 price level before the end of 2019 and potentially fall to levels below $30 in early 2020.
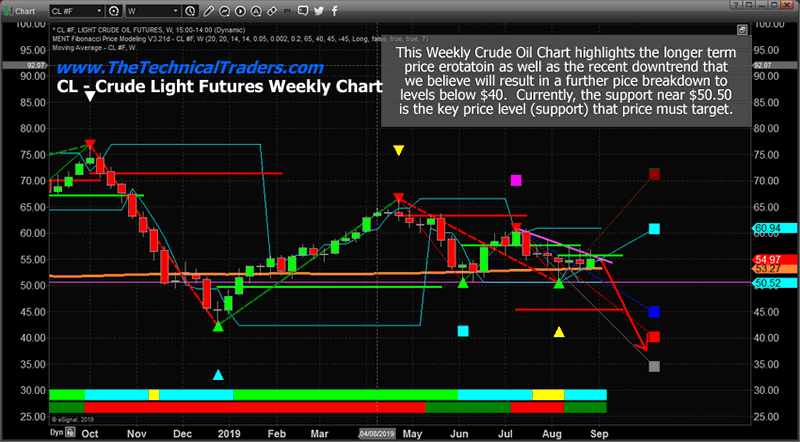
Crude Oil Weekly Chart Analysis
We believe the key to all of this price rotation is the $50.50 level and what price does over the next 30 to 60+ days. There is a potential that price may attempt a brief upside move over this span of time, but the true intent of price is to move lower based on our ADL price modeling system. Therefore, we believe the downside potential is the most opportunistic for traders. The next price target based on our Fibonacci bearish price trigger level is the $45 price range.
CONCLUDING THOUGHTS:
This move could take place quickly, over the next 2 to 3 weeks on a breakdown move, or over many months. Watch the $50.50 level as that is the key. If the price falls to any level below $50.50, then we could be moving towards the $45 level or even the $40 on a big move related to global economic expectations. Otherwise, expect the price to move towards the $50.50 level over the next few weeks as this support level is key to all future moves.
As we wait for the next leg to start to move prices lower, pay attention to any upside price activity as that may present a very clear entry point for skilled technical traders.
We believe our super-cycle research and other proprietary modeling systems are suggesting that price weakness will dominate the markets for the next few months. Ride my coattails as I navigate these financial market and build wealth while others lose nearly everything they own during the next financial crisis and recession.
In short, you should be starting to get a feel of where commodities and asset class is headed for the next 8+ months. The next step is knowing when and what to buy and sell as these turning points take place, and this is the hard part. If you want someone to guide you through the next 12-24 months complete with detailed market analysis and trade alerts (entry, targets and exit price levels) join my ETF Trading Newsletter.
FREE GOLD OR SILVER WITH SUBSCRIPTION!
Chris Vermeulen
www.TheTechnicalTraders.com
Chris Vermeulen has been involved in the markets since 1997 and is the founder of Technical Traders Ltd. He is an internationally recognized technical analyst, trader, and is the author of the book: 7 Steps to Win With Logic
Through years of research, trading and helping individual traders around the world. He learned that many traders have great trading ideas, but they lack one thing, they struggle to execute trades in a systematic way for consistent results. Chris helps educate traders with a three-hour video course that can change your trading results for the better.
His mission is to help his clients boost their trading performance while reducing market exposure and portfolio volatility.
He is a regular speaker on HoweStreet.com, and the FinancialSurvivorNetwork radio shows. Chris was also featured on the cover of AmalgaTrader Magazine, and contributes articles to several leading financial hubs like MarketOracle.co.uk
Disclaimer: Nothing in this report should be construed as a solicitation to buy or sell any securities mentioned. Technical Traders Ltd., its owners and the author of this report are not registered broker-dealers or financial advisors. Before investing in any securities, you should consult with your financial advisor and a registered broker-dealer. Never make an investment based solely on what you read in an online or printed report, including this report, especially if the investment involves a small, thinly-traded company that isn’t well known. Technical Traders Ltd. and the author of this report has been paid by Cardiff Energy Corp. In addition, the author owns shares of Cardiff Energy Corp. and would also benefit from volume and price appreciation of its stock. The information provided here within should not be construed as a financial analysis but rather as an advertisement. The author’s views and opinions regarding the companies featured in reports are his own views and are based on information that he has researched independently and has received, which the author assumes to be reliable. Technical Traders Ltd. and the author of this report do not guarantee the accuracy, completeness, or usefulness of any content of this report, nor its fitness for any particular purpose. Lastly, the author does not guarantee that any of the companies mentioned in the reports will perform as expected, and any comparisons made to other companies may not be valid or come into effect.
Chris Vermeulen Archive |
© 2005-2022 http://www.MarketOracle.co.uk - The Market Oracle is a FREE Daily Financial Markets Analysis & Forecasting online publication.