


Precious Metals Gone Wild! Reaching Initial Targets – Now What’s Next?
Commodities / Gold & Silver 2019 Aug 16, 2019 - 12:58 PM GMTBy: Chris_Vermeulen

 We have heard from so many of our followers and members regarding our precious metals calls and research articles. Additionally, many of our members and followers have recently asked us about our August 19 breakdown prediction for the US/Global markets. In this research post, we’ll highlight some of our expectations for the precious metals and how that relates to the potential August 19 breakdown expectations.
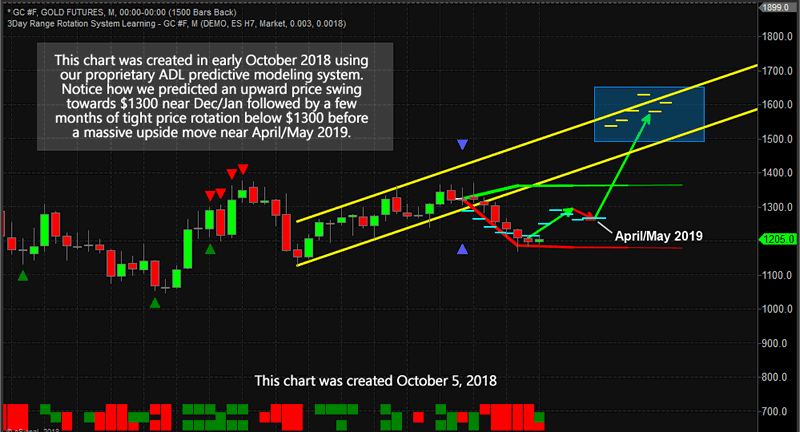
October 5 ADL predictive modeling forecast chart
Our incredible October 5 ADL predictive modeling chart, below, highlights just how powerful some of our proprietary price modeling tools really are. Imagine having the ability to look 10+ months into the future to be able to attempt to understand exactly what price may attempt to do and to be able to plan and prepare for these moves well ahead of the “setup”. So far, our analysis of the precious metals has been spot on and we’ll continue to try to update our members and followers as this movement continues.
RECENT TRADE WITH 3X Gold ETF:
The ADL system hs played a large roll in our short term trading result for August already having closed 24.16% profit this month – See Here
This original prediction based on our advanced Adaptive Dynamic Learning (ADL) predictive price modeling system suggests price should be near or above $1600 by August/September 2019 (the higher yellow dash lines within the blue rectangle). If these predictions continue to hold up as valid and true, then we would expect the price of Gold to target these levels as a “leg 1 move” then consolidate a bit before attempting to move higher.
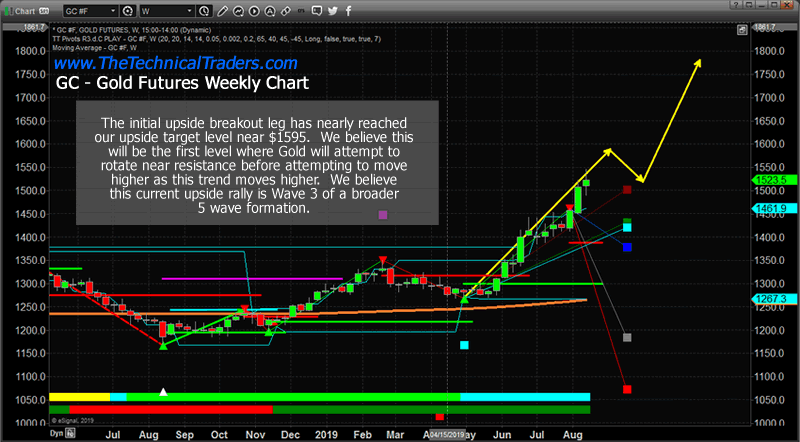
Weekly Gold chart highlights our expectations
This Weekly Gold chart highlights our expectations for the current and future price rotations in Gold. As you can see, we are still expecting a $1600 initial upside price target (shown as $1595) and a brief price rotation after that level is reached. The reality of this move is that Gold could rally well above $1600 before stalling, but we believe the $1595 level is a safe call for this move and we believe the rotation will be fairly short-lived before the price continues to rally further.
One interesting point to make is that the $1595 level is well above the highest (RED) Fibonacci projected price target. These types of moves by price can happen in extended trending. It happens that the Fibonacci price modeling system predicted these ranges based on historical price rotations and recent trends. Yet when something happens in the markets that result in trends extending beyond the predicted levels, it suggests that a larger, more volatile, the price trend has established which could push price levels to 1.6x or 2x the precious target level ranges. This would suggest $1700 to $1850 as a new upside target level (eventually).
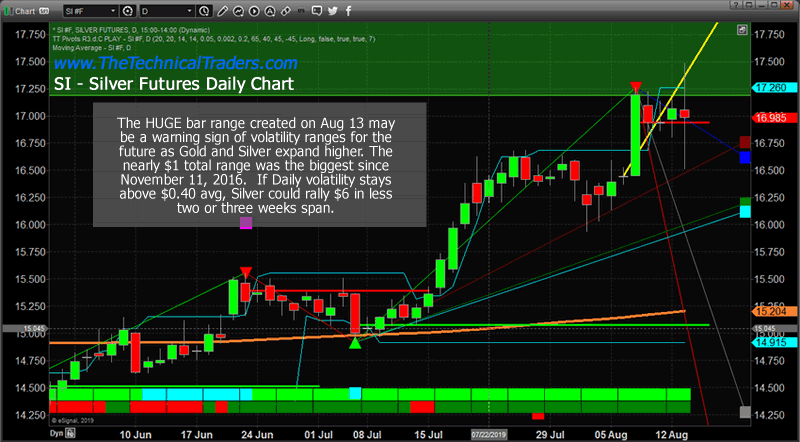
As Silver starts to move higher, finally breaking above historical resistance and really starting to rally as Gold has taken off, one very interesting price setup happened this week – a VERY LARGE RANGE BAR. Silver has historically shown a bar range volatility of near or below $0.40. On August 13, Silver set up a total high-to-low bar range of just over $1.00. This massive increase in volatility suggests that Silver could be setting up for a very explosive price move in the near future. If volatility continues to stay near 1.5x to 2.5x historical levels, Silver could rally $6 to $10 in a very short 14 to 30 days.
What does this mean for our precious metals trade and for our members and followers? It means that the metals are “loading up on fuel” at the moment and preparing for something BIG.
CONCLUDING THOUGHTS:
How is this aligning with our August 19 breakdown prediction and how should traders plan for these moves and protect their assets? Right now, if you have not already set up and entered your precious metals trades, you should consider scaling into trades soon and/or waiting for this rotation that we are suggesting is only about 5+ days away. Silver is still an incredible opportunity for traders and Gold should stall near $1595, then likely rotate a bit lower towards $1525 before bottoming. Therefore, any entry below $1540 in Gold or below $17 in Silver is still a solid entry-level.
Now, before we carry on with our research, we want to highlight the fact that many things are aligning with our August 19 global market breakdown prediction. We’ll go into more detail about this in Part II of this research article and attempt to detail our expectations, but we want to warn you that we believe extended risks will start to become more evident on or after August 19, 2019. This is not a warning that should prompt you to immediately start selling off everything you own and setting up for a massive short trade in the markets. What it means is that August 19 will likely be the start of an extended “rounded top” or other types of extended top formation that will provide a more clear projection of targets and opportunities as it plays out.
You’ll see more in Part II of this research post (delivered to you just in time before the weekend)
MORE UNIQUE ANALYSIS ON THE BEAR MARKET IN STOCKS AND METALS, MINERS, AND S&P 500
I warned that the next financial crisis (bear market) was scary close, possibly just a couple weeks away. The charts I posted will make you really start to worry. See Scary Bear Market Setup Charts.
In early June I posted a detailed video explaining in showing the bottoming formation and gold and where to spot the breakout level, I also talked about crude oil reaching it upside target after a double bottom, and I called short term top in the SP 500 index. This was one of my premarket videos for members it gives you a good taste of what you can expect each and every morning before the Opening Bell. Watch Video Here.
Detailed report talking about where the next bull and bear markets are and how to identify them. This report focused on gold miners and the SP 500 index. My charts compared the 2008 market top and bear market along with the 2019 market prices today. See Comparison Charts Here.
We posted that silver was likely to pause for a week or two before it took another run up on June 26. This played out perfectly as well and silver is now head up to our first key price target of $17. See Silver Price Cycle and Analysis.
Join Me And Trade With a Proven Strategy Today!
Chris Vermeulen
www.TheTechnicalTraders.com
Chris Vermeulen has been involved in the markets since 1997 and is the founder of Technical Traders Ltd. He is an internationally recognized technical analyst, trader, and is the author of the book: 7 Steps to Win With Logic
Through years of research, trading and helping individual traders around the world. He learned that many traders have great trading ideas, but they lack one thing, they struggle to execute trades in a systematic way for consistent results. Chris helps educate traders with a three-hour video course that can change your trading results for the better.
His mission is to help his clients boost their trading performance while reducing market exposure and portfolio volatility.
He is a regular speaker on HoweStreet.com, and the FinancialSurvivorNetwork radio shows. Chris was also featured on the cover of AmalgaTrader Magazine, and contributes articles to several leading financial hubs like MarketOracle.co.uk
Disclaimer: Nothing in this report should be construed as a solicitation to buy or sell any securities mentioned. Technical Traders Ltd., its owners and the author of this report are not registered broker-dealers or financial advisors. Before investing in any securities, you should consult with your financial advisor and a registered broker-dealer. Never make an investment based solely on what you read in an online or printed report, including this report, especially if the investment involves a small, thinly-traded company that isn’t well known. Technical Traders Ltd. and the author of this report has been paid by Cardiff Energy Corp. In addition, the author owns shares of Cardiff Energy Corp. and would also benefit from volume and price appreciation of its stock. The information provided here within should not be construed as a financial analysis but rather as an advertisement. The author’s views and opinions regarding the companies featured in reports are his own views and are based on information that he has researched independently and has received, which the author assumes to be reliable. Technical Traders Ltd. and the author of this report do not guarantee the accuracy, completeness, or usefulness of any content of this report, nor its fitness for any particular purpose. Lastly, the author does not guarantee that any of the companies mentioned in the reports will perform as expected, and any comparisons made to other companies may not be valid or come into effect.
Chris Vermeulen Archive |
© 2005-2022 http://www.MarketOracle.co.uk - The Market Oracle is a FREE Daily Financial Markets Analysis & Forecasting online publication.