


The Stock Market Fell and Volatility Spiked. What’s Next
Stock-Markets / Stock Markets 2019 Aug 02, 2019 - 08:43 AM GMTBy: Troy_Bombardia

 The S&P fell Thursday on trade war-related news and volatility spiked. Today’s headlines:
- More economic weakness in manufacturing.
- Long streak of bad economic surprises
- Stock market’s volatility spiked
- AAII sentiment
- Short term bounce ahead for stocks?
Go here to understand our long term outlook. For reference, here’s the random probability of the U.S. stock market going up on any given day.

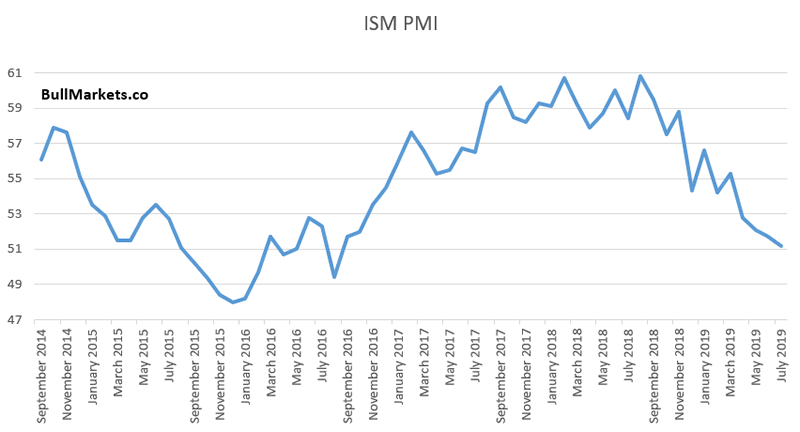
ISM
As we examined yesterday, manufacturing is a weak point in the U.S. economy (along with housing). The latest ISM manufacturing PMI data confirms this. ISM has fallen to 51.2
It’s easy to automatically assume that this is bearish for the stock market. Here’s what happened next to the S&P when ISM manufacturing PMI fell to 51.2 in the past.
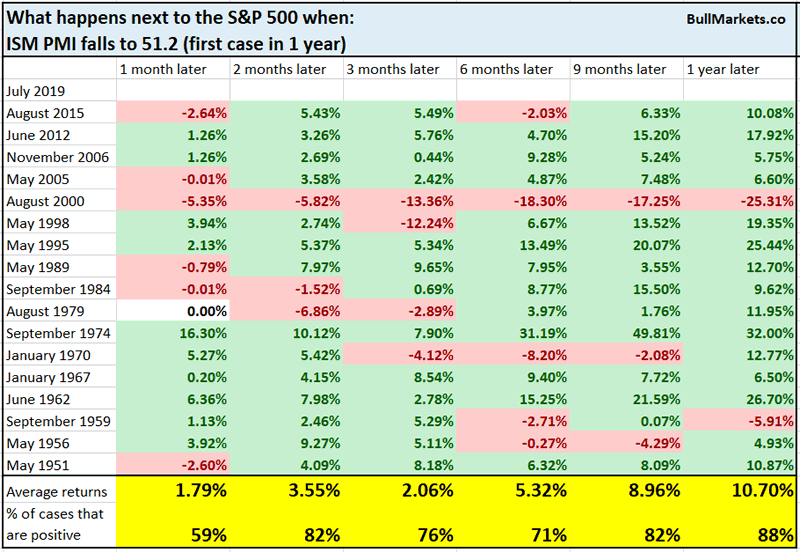
Far from being bearish, the S&P went up 1 year later 88% of the time. Why? Because like many manufacturing-related indicators, the ISM manufacturing PMI has too many false bearish signals.
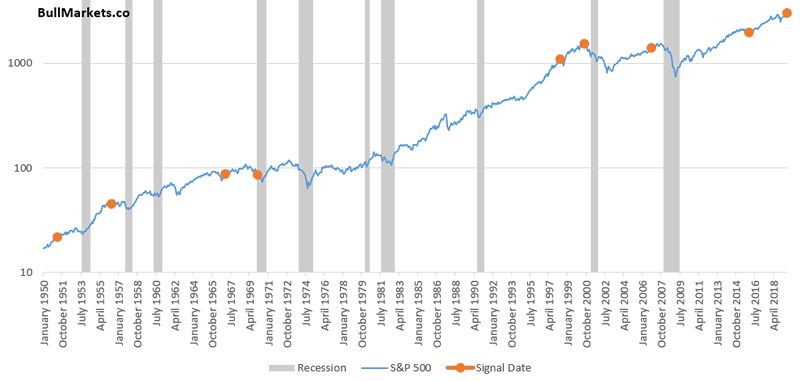
So what if we consider this signal in the context of where we are in this economic expansion cycle? Here’s what happened next to the S&P when ISM PMI fell to 51.2, while unemployment was under 5% (i.e. late-cycle in the economic expansion).
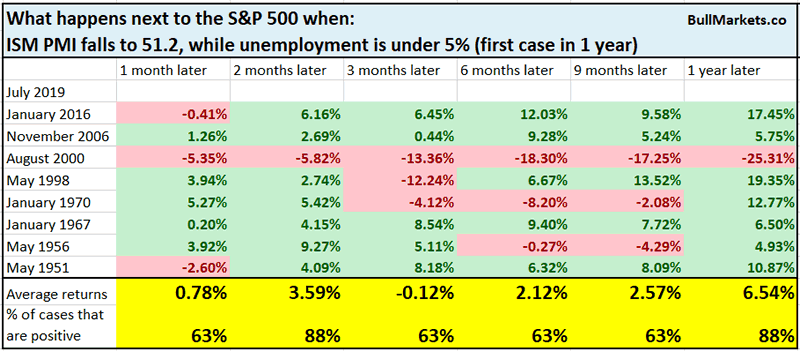
The 6-9 month forward returns are more bearish than random.
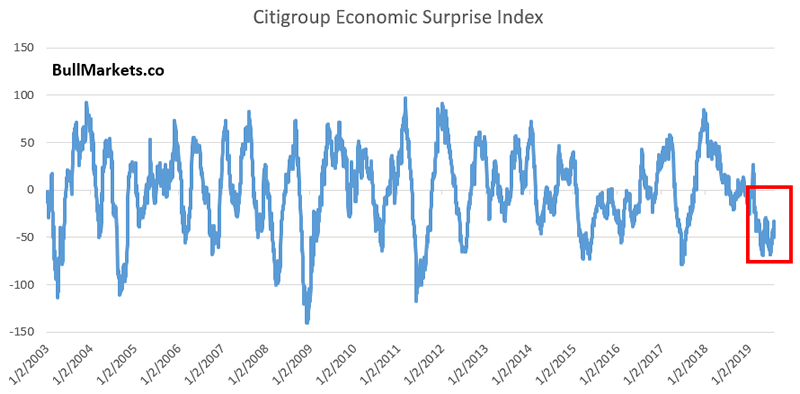
Economic surprises
Amid a never-ending supply of weak manufacturing-related economic data, the Citigroup Economic Surprise Index has been negative for 117 days. This long streak demonstrates that economic data has mostly surprised analysts expectations on the downside.
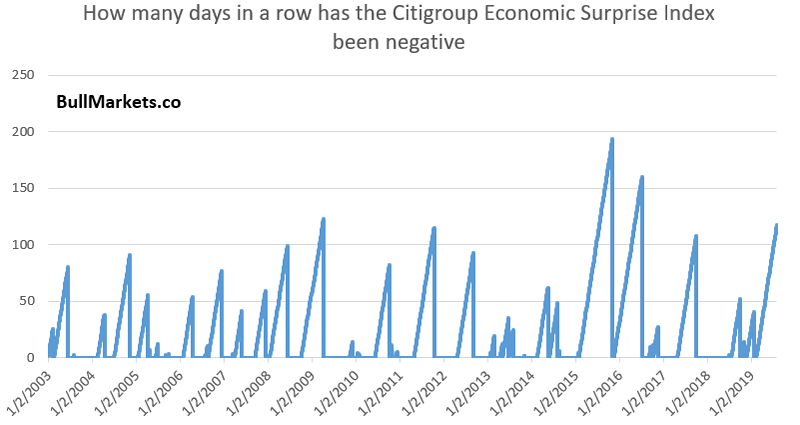
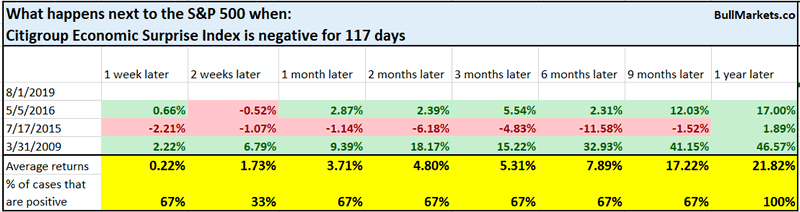
There are only 3 other streaks that matched this length:
- May 2016
- July 2015
- March 2009
Volatility
Over the past week our stats have suggested that the stock market would make a short term pullback/correction and volatility would spike. Lucky bet or not, VIX has spiked.
*There’s a lot of luck involved in short term predictions, no matter how much confidence you have in your forecasting powers. Too many unpredictable events impact the markets in the short run. That’s why I generally don’t make short term predictions.
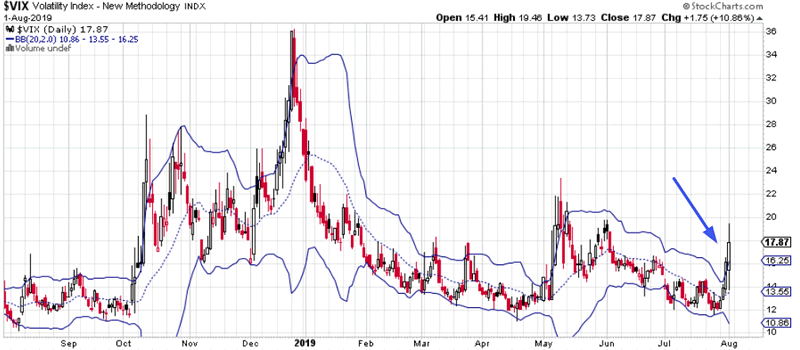
For the first time since May, VIX has closed above its upper Bollinger Band for 2 days in a row. VIX is mean-reverting.
While this isn’t necessarily bullish for the S&P, it is bearish for VIX.
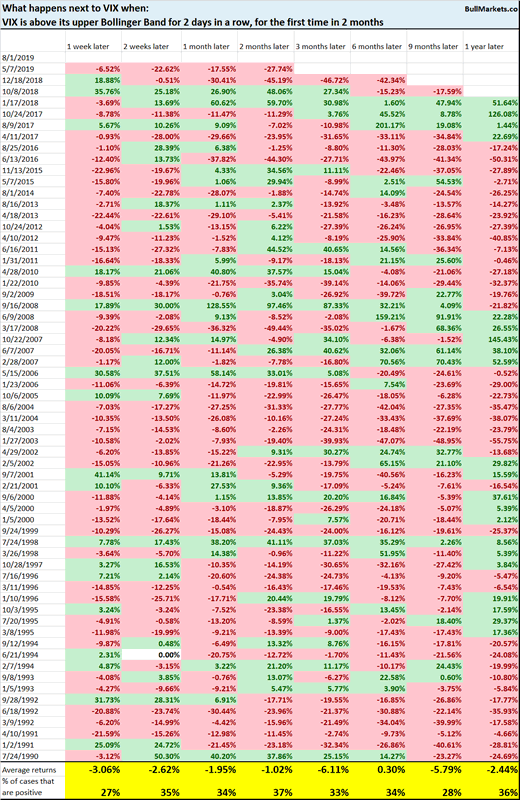
This doesn’t mean that VIX can’t spike for another few days. It just means that the VIX spike we expected has arrived, so from a risk:reward perspective it doesn’t make sense to start going long VIX right now.
Sentiment
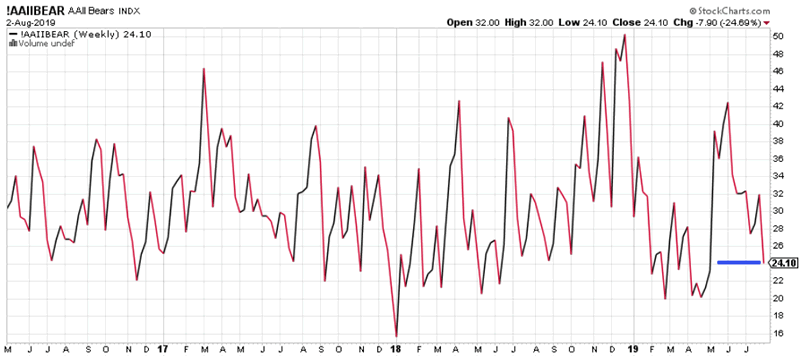
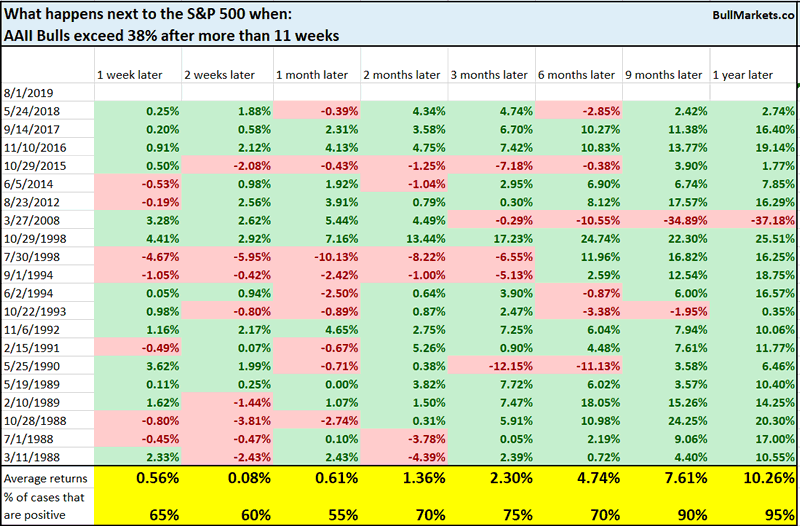
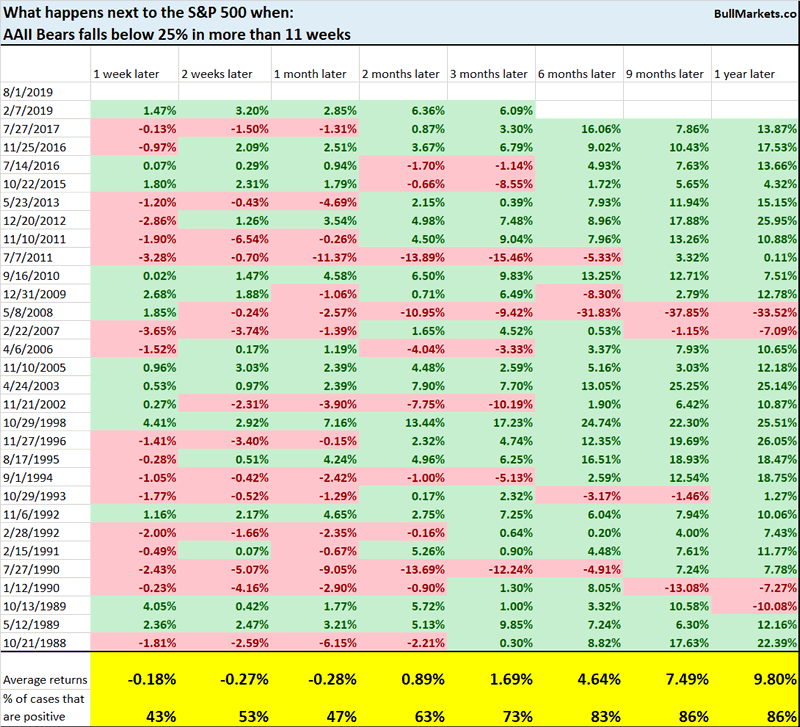
AAII isn’t the best sentiment indicator, but it is a popular one. Bullish sentiment is rising and bearish sentiment is falling. AAII Bulls has exceeded 38% and AAII Bears has fallen below 25% for the first time in 11 weeks.
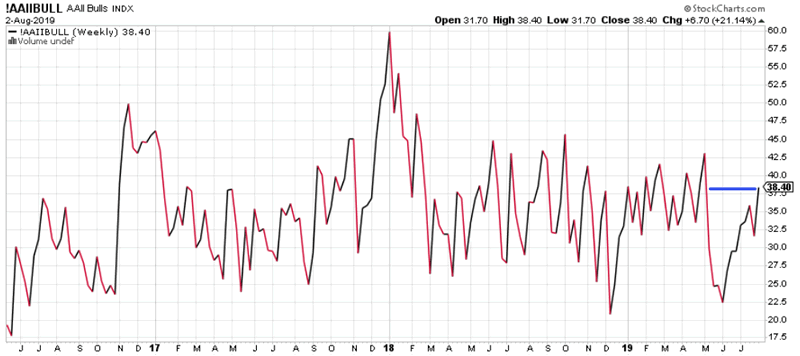
Rising Bullish % was mostly bullish for stocks 1 year later.
Falling Bearish % was slightly short term bearish for stocks, but also long term bullish.

Short term bounce
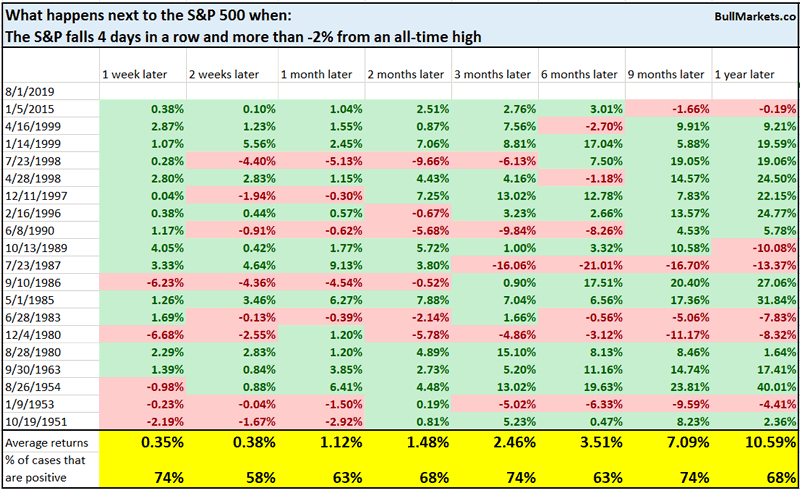
The S&P has fallen 4 days in a row and more than -2% straight from an all-time high.
In the past, this was bullish for the S&P 1 week later.
Remember: be wary of short term predictions.
We don’t use our discretionary outlook for trading. We use our quantitative trading models because they are end-to-end systems that tell you how to trade ALL THE TIME, even when our discretionary outlook is mixed. Members can see our model’s latest trades here updated in real-time.
Conclusion
Here is our discretionary market outlook:
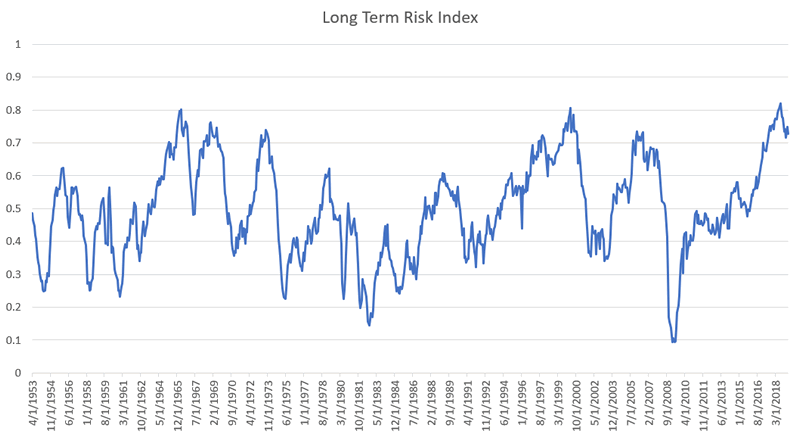
- Long term: risk:reward is not bullish. In a most optimistic scenario, the bull market probably has 1 year left.
- Medium term (next 6-9 months): most market studies lean bullish.
- Short term (next 1-3 months) market studies are mixed/bearish.
- We focus on the medium-long term.
Goldman Sachs’ Bull/Bear Indicator demonstrates that risk:reward favors long term bears.
Click here for more market analysis
By Troy Bombardia
I’m Troy Bombardia, the author behind BullMarkets.co. I used to run a hedge fund, but closed it due to a major health scare. I am now enjoying life and simply investing/trading my own account. I focus on long term performance and ignore short term performance.
Copyright 2019 © Troy Bombardia - All Rights Reserved
Disclaimer: The above is a matter of opinion provided for general information purposes only and is not intended as investment advice. Information and analysis above are derived from sources and utilising methods believed to be reliable, but we cannot accept responsibility for any losses you may incur as a result of this analysis. Individuals should consult with their personal financial advisors.
Troy Bombardia Archive |
© 2005-2022 http://www.MarketOracle.co.uk - The Market Oracle is a FREE Daily Financial Markets Analysis & Forecasting online publication.