


Crude Oil Price Pummeled, Where Is It Going Next?
Commodities / Crude Oil Jul 04, 2019 - 03:54 PM GMTBy: Chris_Vermeulen

 On Tuesday, July 2, 2019, the price of Crude Oil fell over -4.5% on continued expectations of global economic weakness and supply gluts. We found this interview rather interesting because it attempts to suggest a narrative that ignores Iranian issues while pushing the supply side fundamental for the current price decline (Source: CNBC).
Back on May 21, 2019, we shared a post that is still very relevant today. The same price pattern is still in place and the same type of price action is working through the completion of an extended Pennant/Flag formation. We suggest all our follower read this May 21 post to catch up to current market levels.
May 21, 2019, Technical Analysis Post: GLOBAL ECONOMIC TENSIONS TRANSLATE INTO OIL VOLATILITY
Our researchers believe the technical reason why Crude Oil will continue lower is that price rotation has continued to support a downside price trend (Bearish) and that recent price resistance near the upper price channel has been rejected. This is a near perfect example of how the Fibonacci price theory works in real markets. The price must always attempt to establish “new price highs” or “new price lows” AT ALL TIMES.
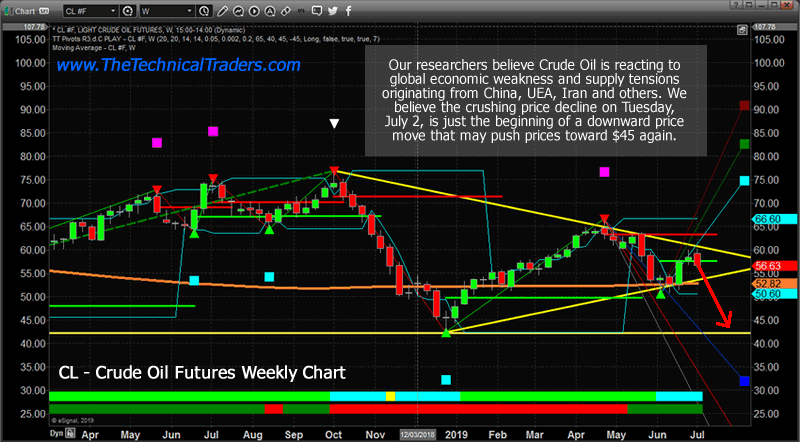
After the deep price bottom in December 2018 near $42.50, oil price began an upside price move reaching just above our $66 target in late April 2019. Since then, another downside price move, which we called in our May 21 article, has driven oil prices to the $50.60 level. The current upside price move has recently retested the $60 resistance level and has pulled back to where we are today around $56 per barrel.
The price rejection and subsequent collapse in price on July 2 represents a clear rotation from the $60 price level. This failure to achieve a “higher high” price level ($60 is lower than the previous peak near $66) is a very clear indication that price MUST move lower in an attempt to establish a new “lower low” – near or below $50.60. This is how the Fibonacci price theory works.
We believe the last level of support for Oil is currently near $54.50. If this level is breached, we should see a very clear and quick price move lower targeting the $50.60 to $52.50 level where historical support resides. If that level fails, then a move to deeper historical support, near $42 if very likely.
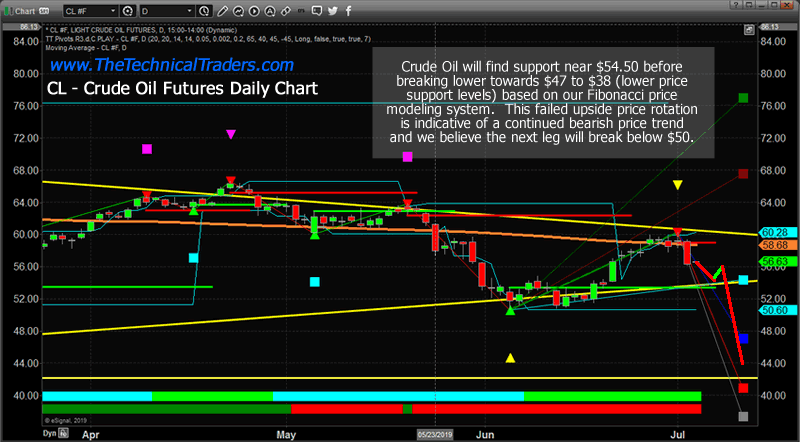
Everything hinges on what Oil will do near the $54.50 level as the price continues to push lower from the recent peak near $60. Technical traders should be prepared for a bit of volatility over the next few days, but we believe the $54.50 level will be breached and that oil prices will continue to fall back towards the previous low price level near $50.60. If price fails to find support there, it really has only one target left to reach – that is the $42 level.
CONCLUDING THOUGHTS:
In a previous article, we’ve shown you when the bottom was in for oil and stocks using our simple trade setup technique we use to identify entry and exit points for SP500 and Crude Oil – the 100% Fibonacci Extension Move. Now a month later we are providing more insight about oils potential drop to $42 if support is broken.
If the price drops below $52 would also create selling pressure as the price will have fallen below the 200-period historical moving average level. This technical condition would suggest price weakness to the masses and could result in additional selling pressure from traders exiting the oil market and potentially even short selling pressure.
Technical traders should have all eyes focused on the $54.50 price level right now. That is the key price level for any future move in Crude Oil as it is oversold currently and near support. Either way, up or down, Crude Oil continues to be an incredible opportunity for skilled technical traders.
I can tell you that huge moves are about to start unfolding not only in real estate, but metals, stocks, and currencies. Some of these super cycles are going to last years. Brad Matheny goes into great detail with his simple to understand charts and guide about this. His financial market research is one of a kind and a real eye-opener. PDF guide: 2020 Cycles – The Greatest Opportunity Of Your Lifetime
As a technical analysis and trader since 1997, I have been through a few bull/bear market cycles. I believe I have a good pulse on the market and timing key turning points for both short-term swing trading and long-term investment capital. The opportunities are massive/life-changing if handled properly.
I urge you to visit my Wealth Building Newsletter and if you like what I offer, join me with the 1 or 2-year subscription to lock in the lowest rate possible, get a FREE BAR OF GOLD and ride my coattails as I navigate these financial market and build wealth while others lose nearly everything they own during the next set of crisis’.
Chris Vermeulen
www.TheTechnicalTraders.com
Chris Vermeulen has been involved in the markets since 1997 and is the founder of Technical Traders Ltd. He is an internationally recognized technical analyst, trader, and is the author of the book: 7 Steps to Win With Logic
Through years of research, trading and helping individual traders around the world. He learned that many traders have great trading ideas, but they lack one thing, they struggle to execute trades in a systematic way for consistent results. Chris helps educate traders with a three-hour video course that can change your trading results for the better.
His mission is to help his clients boost their trading performance while reducing market exposure and portfolio volatility.
He is a regular speaker on HoweStreet.com, and the FinancialSurvivorNetwork radio shows. Chris was also featured on the cover of AmalgaTrader Magazine, and contributes articles to several leading financial hubs like MarketOracle.co.uk
Disclaimer: Nothing in this report should be construed as a solicitation to buy or sell any securities mentioned. Technical Traders Ltd., its owners and the author of this report are not registered broker-dealers or financial advisors. Before investing in any securities, you should consult with your financial advisor and a registered broker-dealer. Never make an investment based solely on what you read in an online or printed report, including this report, especially if the investment involves a small, thinly-traded company that isn’t well known. Technical Traders Ltd. and the author of this report has been paid by Cardiff Energy Corp. In addition, the author owns shares of Cardiff Energy Corp. and would also benefit from volume and price appreciation of its stock. The information provided here within should not be construed as a financial analysis but rather as an advertisement. The author’s views and opinions regarding the companies featured in reports are his own views and are based on information that he has researched independently and has received, which the author assumes to be reliable. Technical Traders Ltd. and the author of this report do not guarantee the accuracy, completeness, or usefulness of any content of this report, nor its fitness for any particular purpose. Lastly, the author does not guarantee that any of the companies mentioned in the reports will perform as expected, and any comparisons made to other companies may not be valid or come into effect.
Chris Vermeulen Archive |
© 2005-2022 http://www.MarketOracle.co.uk - The Market Oracle is a FREE Daily Financial Markets Analysis & Forecasting online publication.