


Is the Market Sending a Crisis Era Signal on the Economy and Stock Market?
Stock-Markets / Stock Markets 2019 Jun 28, 2019 - 11:47 AM GMTBy: Troy_Bombardia

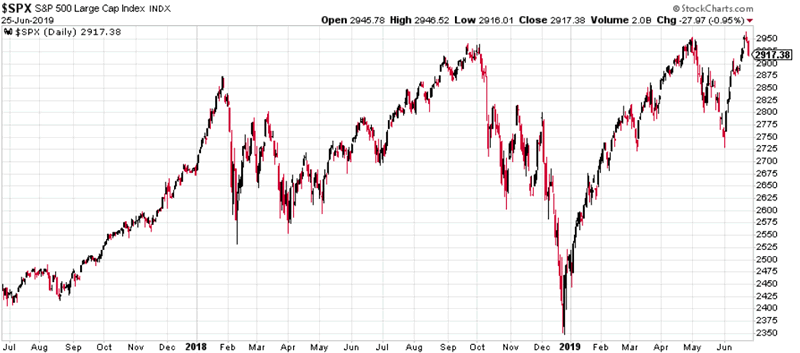
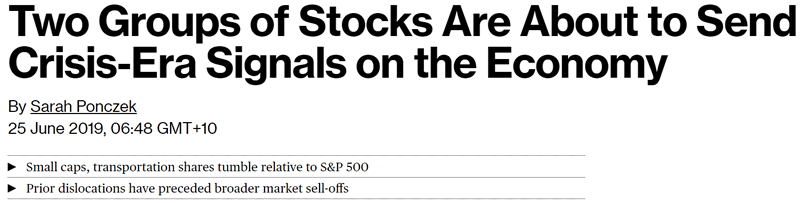
 As the stock market continues to trend higher and Treasury yields continue to collapse, two groups of stocks are about to send crisis-era signals on the economy (according to Bloomberg). Today’s headlines:
- Crisis era signals
- Stocks continue to rally and Treasury yields continue to fall
- Citigroup Economic Surprise Index still deep in negative territory
- Gold’s sentiment extreme and volume
- Bonds sentiment extreme
Go here to understand our fundamentals-driven long term outlook. For reference, here’s the random probability of the U.S. stock market going up on any given day.

Crisis era signals
The problem with “Russell:S&P ratio at its lowest since 2008” is that this ratio is not range-bound. Just because this ratio is at its lowest since 2008, does not mean “today is 2008 all over again”.
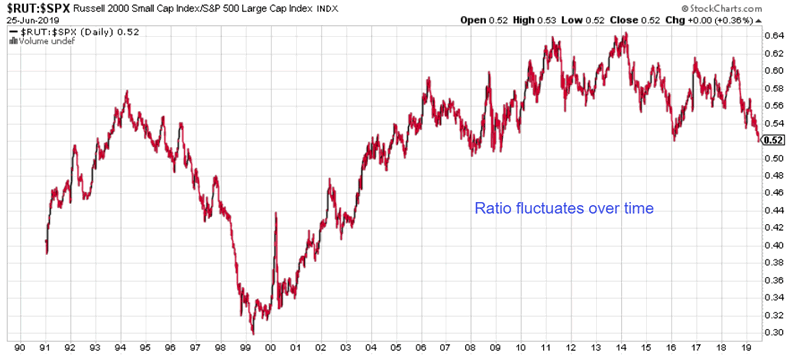
That’s why it’s better to use the ratio’s distance from a long term average instead of using this ratio’s absolute value.
The Russell:S&P and Dow Transportation:S&P ratios were both more than -7% below their 1 year averages as of yesterday. In the past, this was mostly bearish for the S&P 2 weeks – 3 months later…
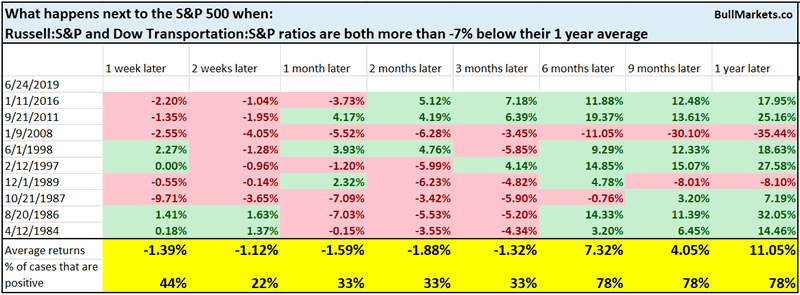
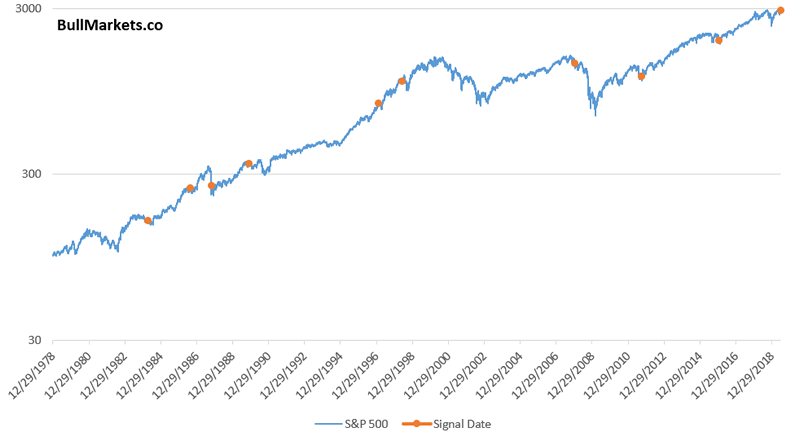
And was mostly bearish for the Russell 2 weeks – 3 months later.
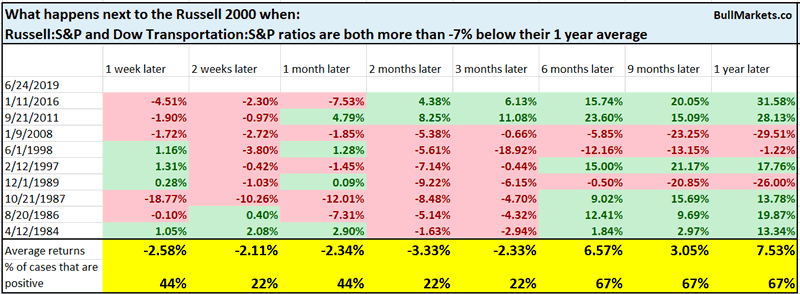
On the other hand, the Dow Transportation Average outperformed over the next 2 weeks – 3 months.
![]()
Overall, this is a short term bearish factor for the stock market, but today is not” like 2008 all over again”.
Stocks continue to rally and bond yields continue to fall
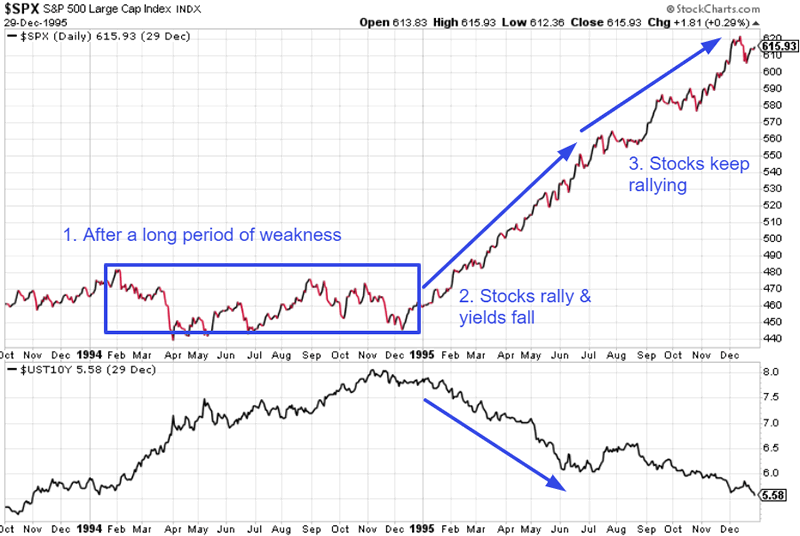
The S&P has rallied more than 20% over the past 6 months while the 10 year Treasury yield’s 6 month rate-of-change is less than -20%. There have been no shortage of market watchers claiming that this is “abnormal” or “unsustainable”.
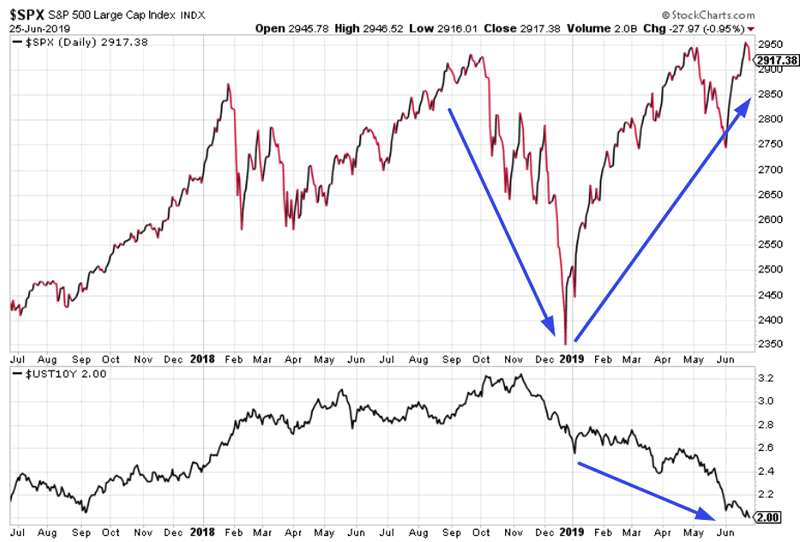
While this is rare, it is not unprecedented. It has happened 4 other times. This is normally what happens after there is a slump in the stock market, followed by a big rally.
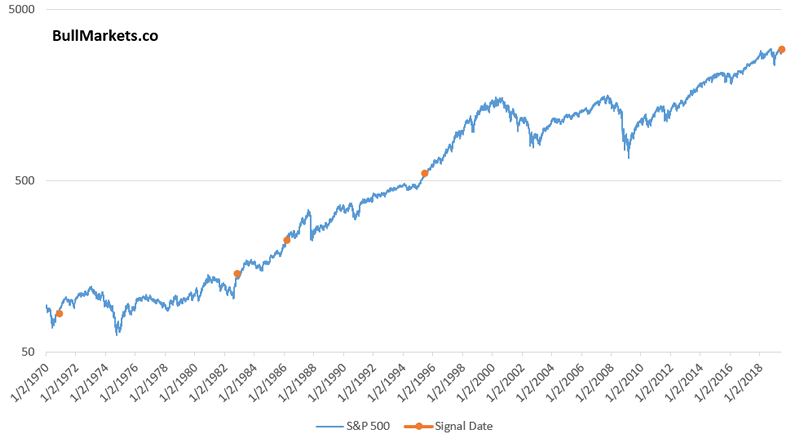
Here’s 1995:
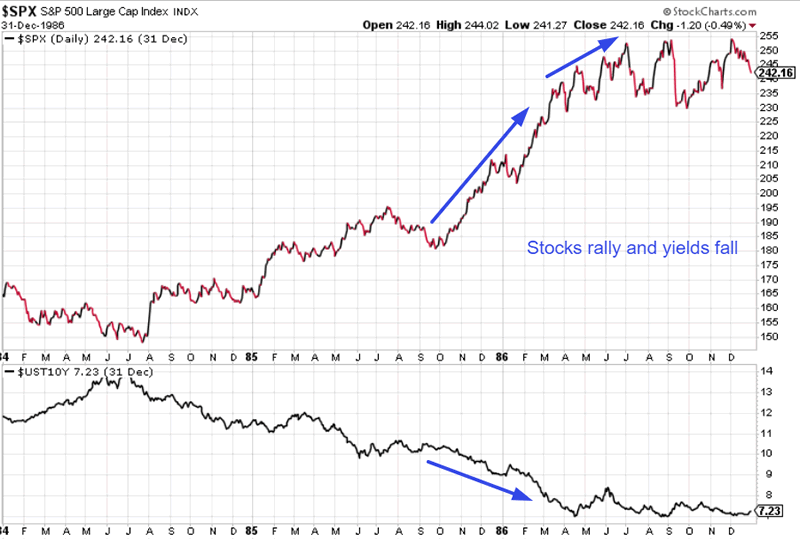
Here’s 1986:
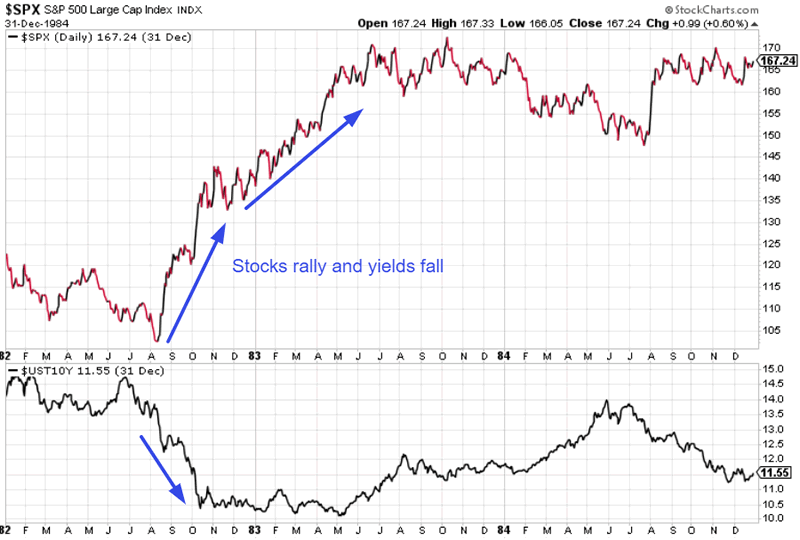
Here’s 1982:
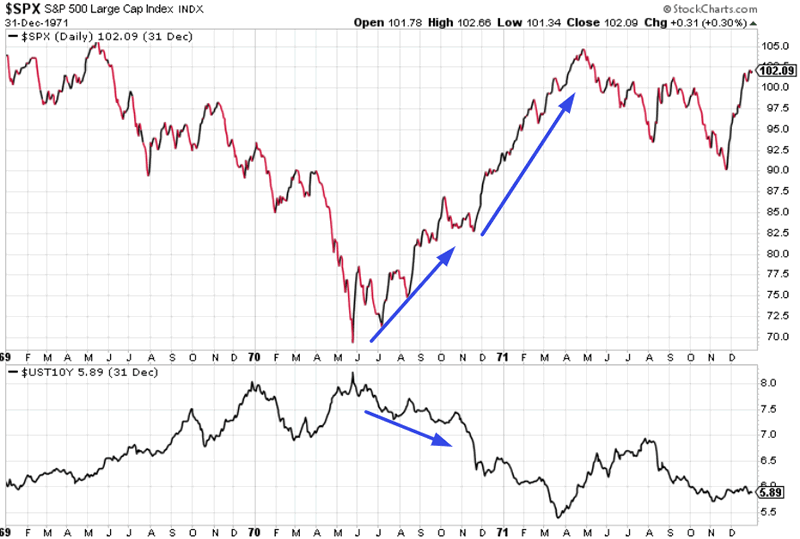
Here’s 1970:
Citigroup Economic Surprise Index
The Citigroup Economic Surprise Index is still deep in negative territory.
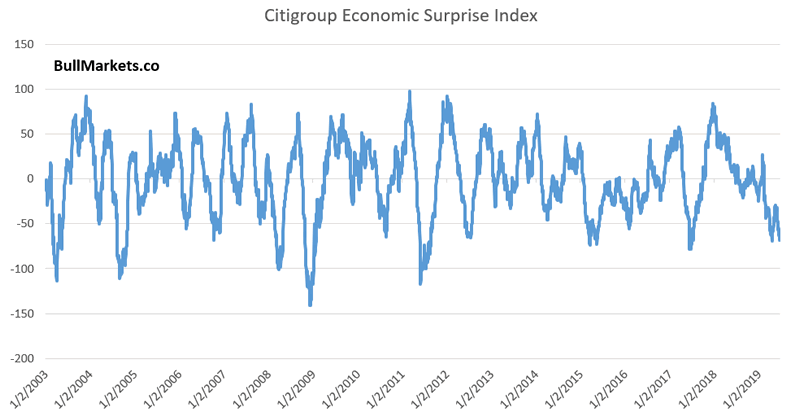
This index has been negative for 91 consecutive days, and considering how low the Index is right now, will probably remain negative for the next few weeks.
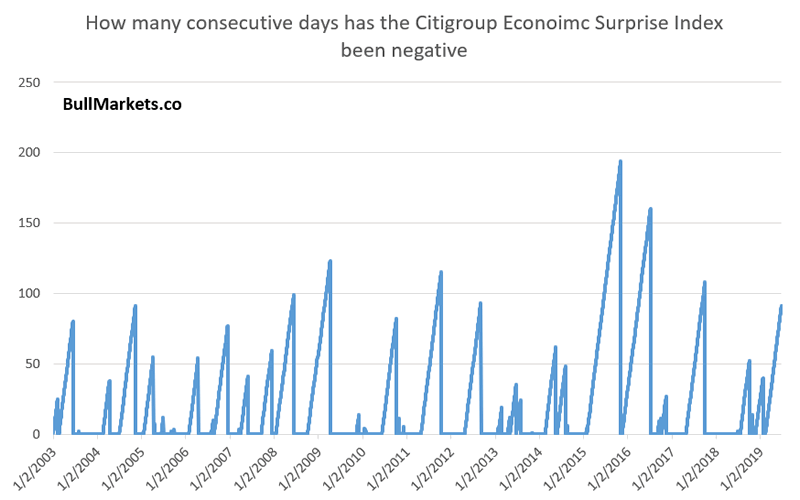
This index is mean reverting. Here’s what happens next to the S&P 500 when the index has been negative for 91 consecutive days.
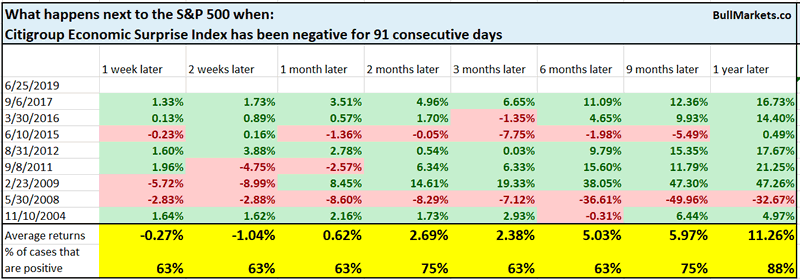
While not always immediately bullish, this is mostly bullish 1 year later.
Gold sentiment and volume
The Daily Sentiment Index is a popular sentiment indicator followed by many traders. Nothing moves sentiment like price. Gold spike = Daily Sentiment Index is also extremely high.
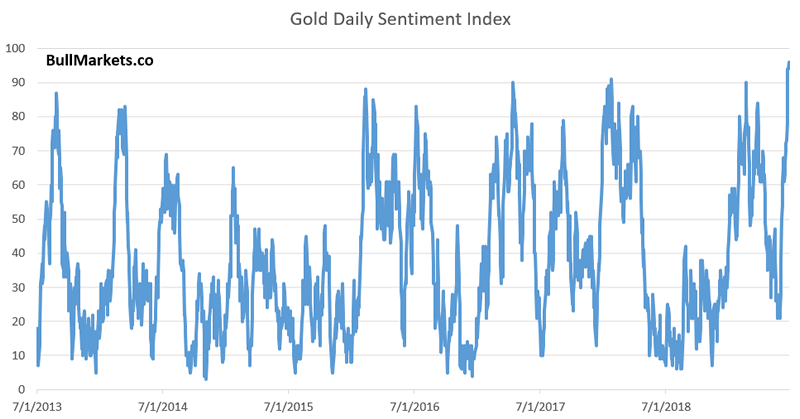
Is this bearish? Here’s what happens next to gold when its DSI (Daily Sentiment Index) exceeds 95
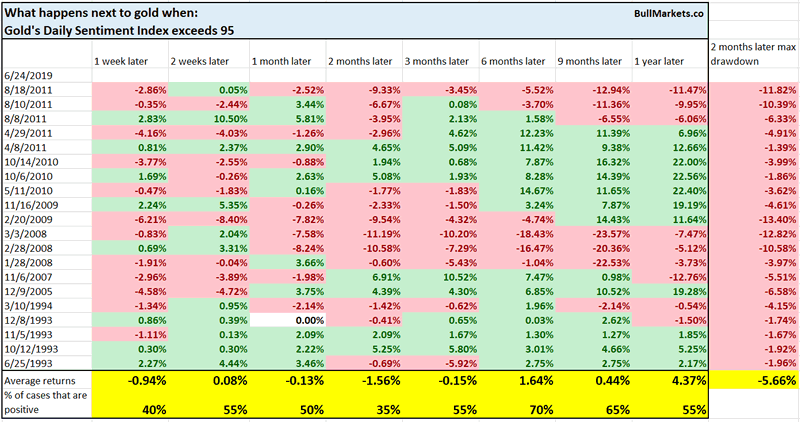
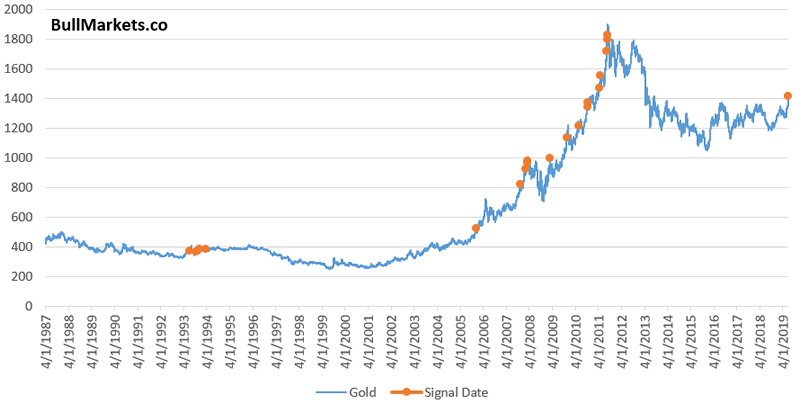
Bearish for gold 2/3 of the time 2 months later, with an average maximum drawdown of -5.66%
However, I would like to caution traders in thinking that such high sentiment is immediately bearish for gold. The short term is extremely hard to predict, especially when a spike captures momentum traders’ imagination. The market can always remain irrational longer than you can stay solvent.
Here’s a stat to prove that the short term is not a sure thing. GLD’s volume spiked today. Volume spikes tend to occur when the market is crashing. It doesn’t often happen during an uptrend, unless the market is surging (i.e. right now).
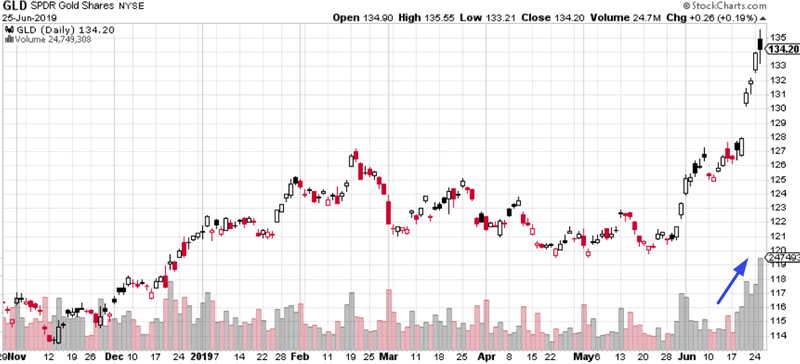
Here’s what happens next to gold when GLD’s volume is more than 200% greater than its 50 day average, when gold went up today.
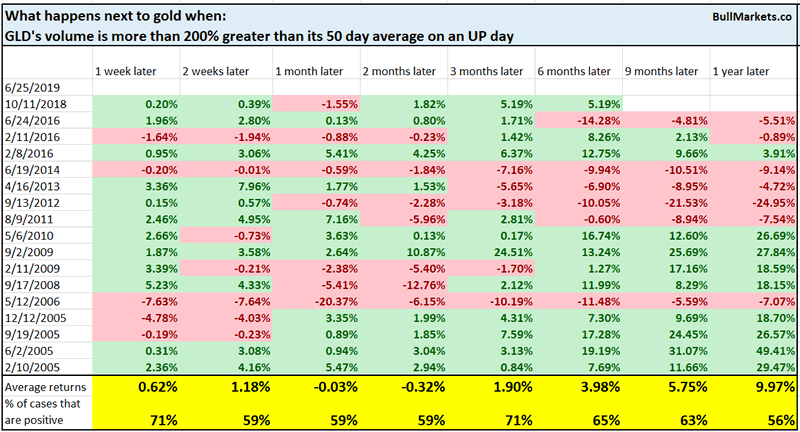
1 week forward returns are more bullish than random. The short term is always extremely hard to predict.
Bonds sentiment
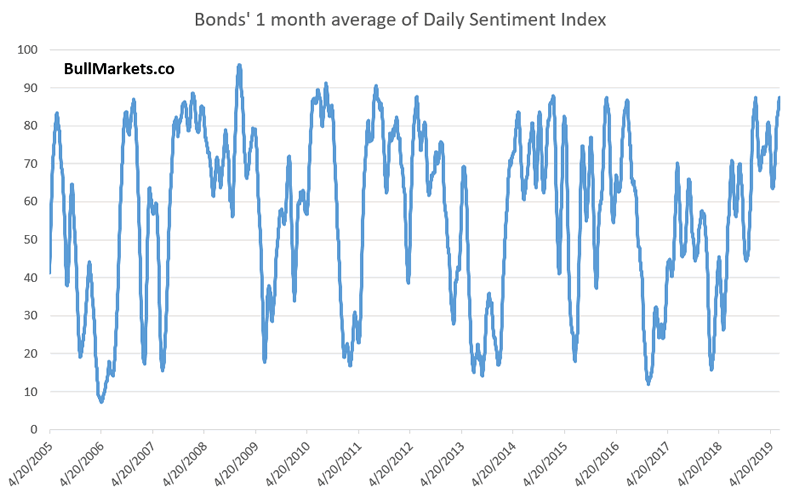
Market participants are extremely bullish on bonds. The 1 month average for bonds’ Daily Sentiment Index now exceeds 87.
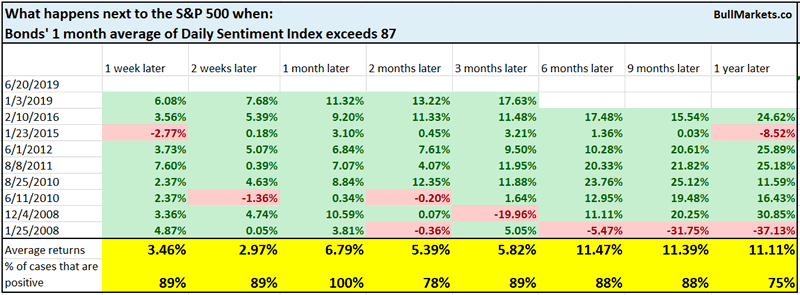
Here’s what happens next to the 10 year Treasury yield when the 1 month average exceeds 87.
Mostly bullish for yields (and bearish for bond prices) 6-9 months later, which is what you would expect given such high sentiment. Is this consistently bullish or bearish for the S&P?
We don’t use our discretionary outlook for trading. We use our quantitative trading models because they are end-to-end systems that tell you how to trade ALL THE TIME, even when our discretionary outlook is mixed. Members can see our model’s latest trades here updated in real-time.
Conclusion
Here is our discretionary market outlook:
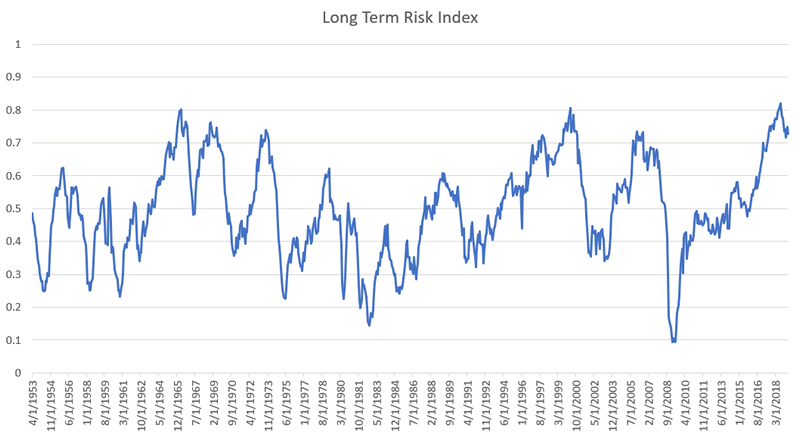
- Long term: risk:reward is not bullish. In a most optimistic scenario, the bull market probably has 1 year left.
- Medium term (next 6-9 months): most market studies are bullish.
- Short term (next 1-3 months) market studies are mixed.
- We focus on the medium-long term.
Goldman Sachs’ Bull/Bear Indicator demonstrates that risk:reward does favor long term bears.
Click here for more market analysis
Here’s what happens next to the S&P when lumber rallies above its 50 week moving
By Troy Bombardia
I’m Troy Bombardia, the author behind BullMarkets.co. I used to run a hedge fund, but closed it due to a major health scare. I am now enjoying life and simply investing/trading my own account. I focus on long term performance and ignore short term performance.
Copyright 2019 © Troy Bombardia - All Rights Reserved
Disclaimer: The above is a matter of opinion provided for general information purposes only and is not intended as investment advice. Information and analysis above are derived from sources and utilising methods believed to be reliable, but we cannot accept responsibility for any losses you may incur as a result of this analysis. Individuals should consult with their personal financial advisors.
Troy Bombardia Archive |
© 2005-2022 http://www.MarketOracle.co.uk - The Market Oracle is a FREE Daily Financial Markets Analysis & Forecasting online publication.