


Gold Marks Time, Gold Stocks Trend Still Extremely Bearish
Commodities / Gold & Silver Sep 28, 2008 - 11:02 AM GMTBy: Merv_Burak

 After a sharp move on Monday it seemed that gold bugs just threw in the towel and stepped to the sidelines. The rest of the week was basically a lateral move with a downside bias. Everyone is now waiting for this week to see what the politicians will do.
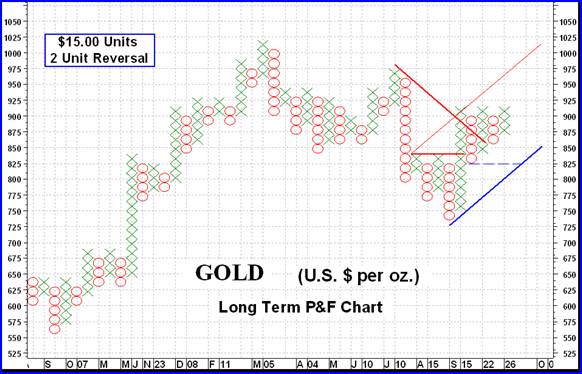
GOLD : LONG TERM Two weeks ago I showed the long term P&F chart dating back to the start of this long bull trend (interspersed with some short downer periods). I thought it was appropriate to update it as the chart is in a very interesting position. Although the bull break had been a very weak one with a projection only to the $930 level, which it almost reached, the subsequent consolidation on the chart suggests that a more major move may be ahead.
A move to the $930 level would be a new break-out and would then project to at least the $1050 level, a new high. That could set in motion all sorts of possibilities that we would have to look at when and if it should come to past. On the other hand a move back to the $825 level could have a serious negative impact.
Looking at the regular chart and indicators the price of gold (presently using the Dec 2008 contract data) closed on Friday just below its long term moving average and the moving average is still very slightly sloping downward. The long term momentum indicator, however, remains just above its neutral line in the positive zone and above its positive trigger line. The volume indicator is showing very little speculative interest in gold one way or the other and is in more of a lateral trend but below its negative trigger line. All in all, we are still in a – NEUTRAL rating period.
INTERMEDIATE TERM
Despite a sharp move upward on Monday the rest of the week pretty well nullified its effect. By the end of the week we were back where we were a week ago as far as the indicators and ratings are concerned. Gold remains above its moving average line and the line slope remains very, very gently upwards. The momentum indicator remains in its positive zone but only slightly. It is also slightly above its positive trigger line. The volume indicator, as mentioned above, continues to move sideways below its negative trigger line. All this had given us a bullish rating last week and the rating remains the same, at BULLISH .
There is that problem with the volume indicator. Its weakness does not bode well for a continued advance in the price of gold. If it doesn't perk up soon then we may expect the price of gold to possibly take a downward direction.
SHORT TERM
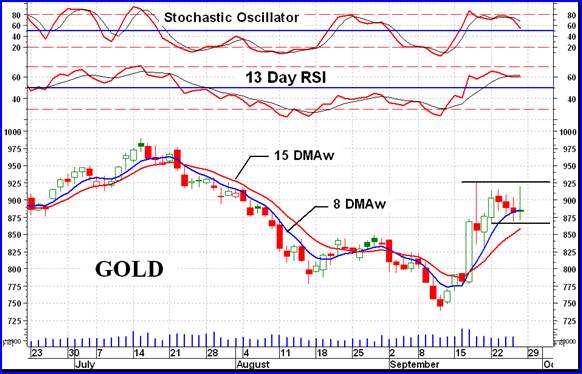
Looking at the short term chart most of the trend and momentum indicators are still positive but if we go a little deeper into the very short term we start to get an uncomfortable feeling. First, the short term. As we see, gold remains above its short term moving average line (15 DMAw) and the line is still sloping upwards. The short term momentum remains in its positive zone but has now dropped below its still positive trigger line. Gold seems to be trapped, at least for now, inside a “box” pattern. All is still in place for a BULLISH short term rating.
As for the immediate direction of least resistance, well that seems to be edging towards the down side. Gold closed Friday just a hair below its very short term moving average line and the Stochastic Oscillator seems to be running at full speed towards its negative zone and is already below its negative trigger line. For now the immediate direction of least resistance seems to be towards the down side.
SILVER
Although silver had a pretty good week it still has far to go to meet gold's recent performance. While gold is consolidating above its previous resistance (now a support) line silver is still far below its line. On the silver chart this line is at the $16 mark while on the gold chart it is at the $850 mark (see comparative charts in the 12 Sept 2008 commentary). It does look like silver may be developing a bullish reverse head and shoulder pattern but I would be careful with it. I like to see the momentum indicator show a positive divergence at the head but we have no such divergence. That doesn't mean that a reverse head and shoulder cannot develop, only that the risk is higher of it proving its projection should it develop.
Although there has been a two week rally the price of silver is still below its intermediate term moving average line and the line is still sloping downward. The intermediate term momentum indicator remains in its negative zone but is above its positive trigger line. The volume indicator seems to be going nowhere except sideways despite the two week rally. Seems there is little speculative interest on the up side to this point. Where gold is rated as bullish silver is rated as intermediate term BEARISH .
PRECIOUS METAL STOCKS
Since late February the average gold and silver stock, as represented by the 160 stocks of the Merv's Gold & Silver 160 Index, has taken a severe tumble, almost the reverse of its sharp advance of late 2005 and early 2006. I guess what goes up must come down. There are many analysts out there who claim this is a very good time to pick up bargains, as they have been claiming throughout the decline. They will be right at some point. I have been cautioning readers for many months now that there will be plenty of profits to be made once the turn around is upon us but the thing is to sit tight, hold on to your capital and wait for the turn to be confirmed. That time has not yet come.
Looking over where these 160 stocks rate (technically) we see that the bias is still on the bearish side. For the short term the ratings stand at 48% BULL and 37% BEAR. On the intermediate term those ratings are 18% BULL and 69% BEAR while on the long term it's 6% BULL and 85% BEAR. So we see that these stocks still have a lot of work to do before they become lower risk investments. The short term is the place to look for a hint of a reversal in the works but also on the short term we have more whip-saw events, but it is a place to watch for advance warnings. Subscribers to my Merv's Precious Metals Central service do get a weekly table of the 25 best short term (and intermediate and long term) performers. This is where one might get the first hints as to what is starting to move BUT as I mentioned, the short term is very volatile and these stocks have a habit of reversing quickly.
MERV'S PRECIOUS METALS INDICES TABLE
Let's call it another week.
By Merv Burak, CMT
Hudson Aero/Systems Inc.
Technical Information Group
for Merv's Precious Metals Central
For DAILY Uranium stock commentary and WEEKLY Uranium market update check out my new Technically Uranium with Merv blog at http://techuranium.blogspot.com .
During the day Merv practices his engineering profession as a Consulting Aerospace Engineer. Once the sun goes down and night descends upon the earth Merv dons his other hat as a Chartered Market Technician ( CMT ) and tries to decipher what's going on in the securities markets. As an underground surveyor in the gold mines of Canada 's Northwest Territories in his youth, Merv has a soft spot for the gold industry and has developed several Gold Indices reflecting different aspects of the industry. As a basically lazy individual Merv's driving focus is to KEEP IT SIMPLE .
To find out more about Merv's various Gold Indices and component stocks, please visit http://preciousmetalscentral.com . There you will find samples of the Indices and their component stocks plus other publications of interest to gold investors.
Before you invest, Always check your market timing with a Qualified Professional Market Technician
Merv Burak Archive |
© 2005-2022 http://www.MarketOracle.co.uk - The Market Oracle is a FREE Daily Financial Markets Analysis & Forecasting online publication.